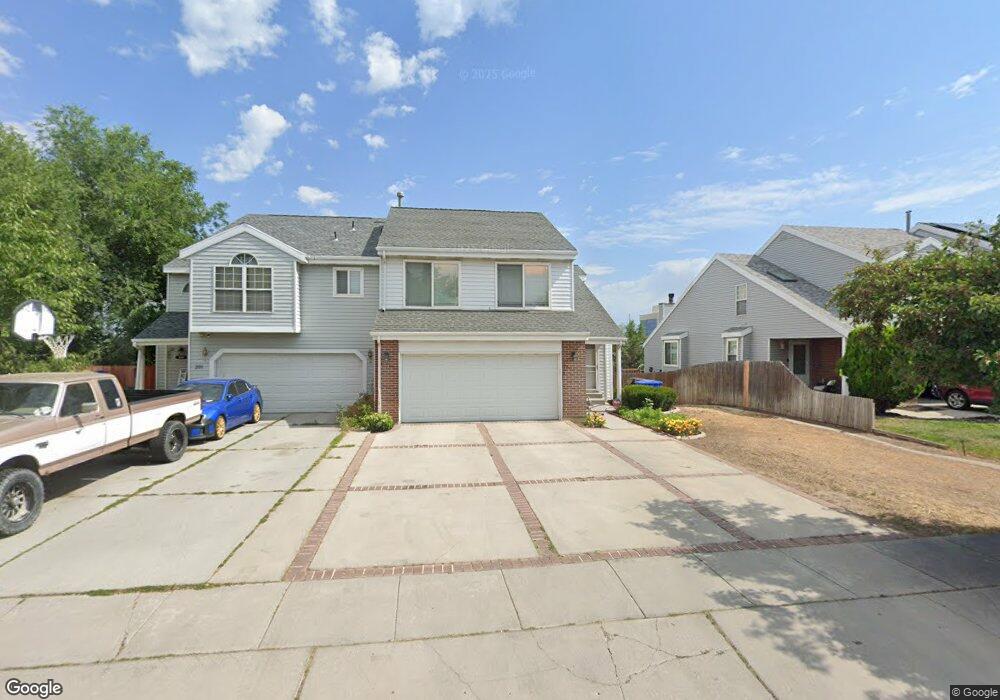
393 E Acoma Rd Midvale, UT 84047
Estimated Value: $494,000 - $554,000
3
Beds
3
Baths
2,442
Sq Ft
$210/Sq Ft
Est. Value
About This Home
This home is located at 393 E Acoma Rd, Midvale, UT 84047 and is currently estimated at $513,221, approximately $210 per square foot. 393 E Acoma Rd is a home located in Salt Lake County with nearby schools including East Midvale Elementary School, Hillcrest High School, and Midvale Middle School.
Ownership History
Date
Name
Owned For
Owner Type
Purchase Details
Closed on
Aug 26, 2020
Sold by
Nguyen Phi and Vu Jim Hoang
Bought by
Nguyen Phi
Current Estimated Value
Home Financials for this Owner
Home Financials are based on the most recent Mortgage that was taken out on this home.
Original Mortgage
$276,000
Outstanding Balance
$244,932
Interest Rate
2.9%
Mortgage Type
New Conventional
Estimated Equity
$268,289
Purchase Details
Closed on
Jun 14, 2019
Sold by
Nguyen Lich T and Nguyen Phi
Bought by
Nguyen Phi and Vu Jim Hoang
Home Financials for this Owner
Home Financials are based on the most recent Mortgage that was taken out on this home.
Original Mortgage
$272,435
Interest Rate
4%
Mortgage Type
FHA
Purchase Details
Closed on
Jul 19, 2017
Sold by
Byerly Bryan and Byerly Trista V
Bought by
Nguyen Phi and Nguyen Lich T
Home Financials for this Owner
Home Financials are based on the most recent Mortgage that was taken out on this home.
Original Mortgage
$255,290
Interest Rate
4.4%
Mortgage Type
FHA
Purchase Details
Closed on
Mar 17, 2006
Sold by
Byerly Bryan
Bought by
Byerly Bryan and Byerly Trista
Purchase Details
Closed on
Jul 3, 2001
Sold by
Allred Michael S
Bought by
Byerly Bryan
Home Financials for this Owner
Home Financials are based on the most recent Mortgage that was taken out on this home.
Original Mortgage
$118,800
Interest Rate
8.5%
Purchase Details
Closed on
Sep 13, 1996
Sold by
Runge Mary
Bought by
Allred Michael S
Home Financials for this Owner
Home Financials are based on the most recent Mortgage that was taken out on this home.
Original Mortgage
$128,666
Interest Rate
7.87%
Mortgage Type
Seller Take Back
Purchase Details
Closed on
Mar 3, 1995
Sold by
Hauser Laura F
Bought by
Mills Dennis Jay and Weiher Leslie Ann
Home Financials for this Owner
Home Financials are based on the most recent Mortgage that was taken out on this home.
Original Mortgage
$130,000
Interest Rate
9.09%
Mortgage Type
VA
Create a Home Valuation Report for This Property
The Home Valuation Report is an in-depth analysis detailing your home's value as well as a comparison with similar homes in the area
Home Values in the Area
Average Home Value in this Area
Purchase History
| Date | Buyer | Sale Price | Title Company |
|---|---|---|---|
| Nguyen Phi | -- | Bay National Title Company | |
| Nguyen Phi | -- | Bay National Title Company | |
| Nguyen Phi | -- | Meridian Title | |
| Byerly Bryan | -- | Accommodation | |
| Byerly Bryan | -- | Superior Title Company | |
| Allred Michael S | -- | -- | |
| Runge Mary | -- | -- | |
| Mills Dennis Jay | -- | -- |
Source: Public Records
Mortgage History
| Date | Status | Borrower | Loan Amount |
|---|---|---|---|
| Open | Nguyen Phi | $276,000 | |
| Closed | Nguyen Phi | $272,435 | |
| Closed | Nguyen Phi | $255,290 | |
| Previous Owner | Byerly Bryan | $118,800 | |
| Previous Owner | Runge Mary | $128,666 | |
| Previous Owner | Allred Michael S | $3,266 | |
| Previous Owner | Mills Dennis Jay | $130,000 | |
| Closed | Byerly Bryan | $29,700 |
Source: Public Records
Tax History
| Year | Tax Paid | Tax Assessment Tax Assessment Total Assessment is a certain percentage of the fair market value that is determined by local assessors to be the total taxable value of land and additions on the property. | Land | Improvement |
|---|---|---|---|---|
| 2025 | $2,683 | $465,200 | $125,200 | $340,000 |
| 2024 | $2,683 | $440,500 | $118,200 | $322,300 |
| 2023 | $2,683 | $403,600 | $112,300 | $291,300 |
| 2022 | $2,621 | $416,600 | $93,600 | $323,000 |
| 2021 | $2,328 | $316,300 | $86,400 | $229,900 |
| 2020 | $2,209 | $284,000 | $71,000 | $213,000 |
| 2019 | $2,080 | $260,600 | $67,000 | $193,600 |
| 2018 | $2,001 | $253,500 | $67,000 | $186,500 |
| 2017 | $1,762 | $214,500 | $67,000 | $147,500 |
| 2016 | $1,674 | $197,700 | $67,000 | $130,700 |
| 2015 | $1,422 | $165,000 | $65,600 | $99,400 |
| 2014 | $1,439 | $163,100 | $66,300 | $96,800 |
Source: Public Records
Map
Nearby Homes
- 283 E Vaughn Ln Unit 12
- 6715 S Vaughn Ln Unit 8
- 6717 S Vaughn Ln Unit 9
- 6714 S Vaughn Ln Unit 23
- 6718 S Vaughn Ln Unit 21
- 6716 S Vaughn Ln Unit 22
- 6720 S Vaughn Ln Unit 20
- 512 E Larchwood Dr
- 347 E Winchester St
- 6290 S 440 E
- 6310 S 530 E
- 6874 S 595 E Unit 66
- 288 E 6280 S
- 321 E 6240 S
- 7033 S 300 E
- 7045 S 300 E
- 6969 S Free Land Ave
- 195 E 7060 S
- 6965 S 700 E
- 6954 S 85 E
Your Personal Tour Guide
Ask me questions while you tour the home.