393 East St Brockton, MA 02302
Estimated Value: $576,000 - $658,000
4
Beds
3
Baths
2,340
Sq Ft
$261/Sq Ft
Est. Value
About This Home
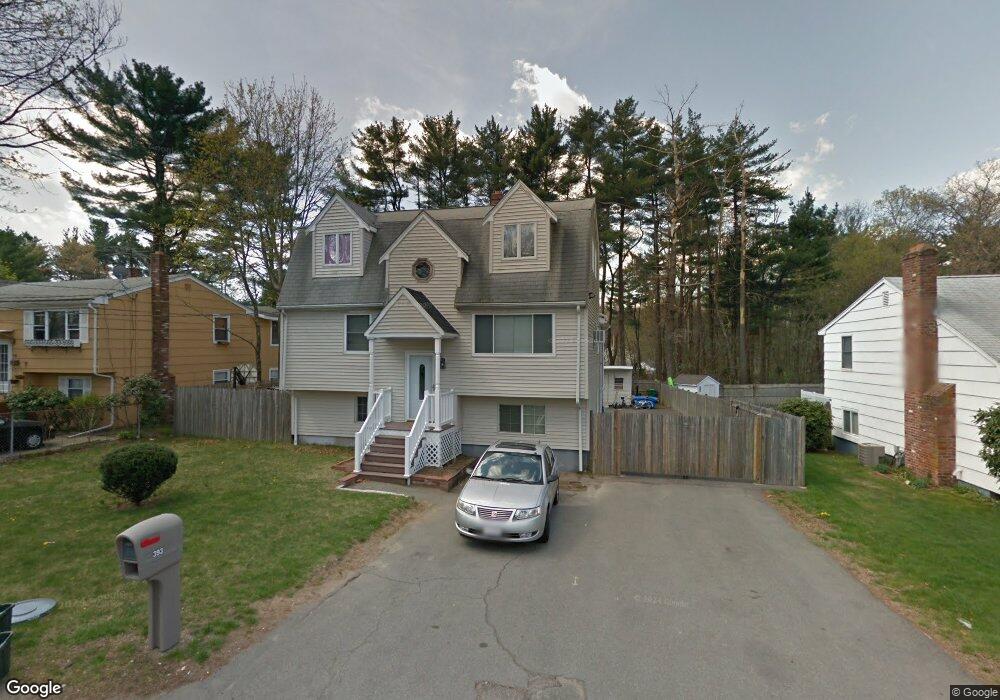
This home is located at 393 East St, Brockton, MA 02302 and is currently estimated at $611,144, approximately $261 per square foot. 393 East St is a home located in Plymouth County with nearby schools including Davis K-8 School, John F. Kennedy Elementary School, and South Middle School.
Ownership History
Date
Name
Owned For
Owner Type
Purchase Details
Closed on
Nov 21, 2003
Sold by
Daniels Julian and Daniels Richard S
Bought by
Calcano Jequeta A
Current Estimated Value
Purchase Details
Closed on
May 8, 2003
Sold by
Daniels Julian
Bought by
Daniels Julian and Daniels Richard S
Purchase Details
Closed on
Jul 18, 2000
Sold by
Dumoulin Nivon and Dumoulin Leonne
Bought by
Daniels Julian
Purchase Details
Closed on
Dec 20, 1999
Sold by
Jean France M
Bought by
Dumoulin Nivon and Dumoulin Leonne N
Purchase Details
Closed on
Feb 28, 1989
Sold by
Fulginiti Francis A
Bought by
Jean France M
Create a Home Valuation Report for This Property
The Home Valuation Report is an in-depth analysis detailing your home's value as well as a comparison with similar homes in the area
Home Values in the Area
Average Home Value in this Area
Purchase History
| Date | Buyer | Sale Price | Title Company |
|---|---|---|---|
| Calcano Jequeta A | $270,000 | -- | |
| Daniels Julian | -- | -- | |
| Daniels Julian | $192,900 | -- | |
| Dumoulin Nivon | $165,000 | -- | |
| Jean France M | $156,000 | -- |
Source: Public Records
Mortgage History
| Date | Status | Borrower | Loan Amount |
|---|---|---|---|
| Open | Jean France M | $30,300 | |
| Open | Jean France M | $237,000 |
Source: Public Records
Tax History Compared to Growth
Tax History
| Year | Tax Paid | Tax Assessment Tax Assessment Total Assessment is a certain percentage of the fair market value that is determined by local assessors to be the total taxable value of land and additions on the property. | Land | Improvement |
|---|---|---|---|---|
| 2025 | $6,288 | $519,200 | $158,100 | $361,100 |
| 2024 | $6,057 | $503,900 | $158,100 | $345,800 |
| 2023 | $5,929 | $456,800 | $108,300 | $348,500 |
| 2022 | $5,371 | $384,500 | $98,400 | $286,100 |
| 2021 | $5,094 | $351,300 | $90,700 | $260,600 |
| 2020 | $5,307 | $350,300 | $79,800 | $270,500 |
| 2019 | $5,080 | $326,900 | $76,000 | $250,900 |
| 2018 | $4,911 | $305,800 | $76,000 | $229,800 |
| 2017 | $4,455 | $276,700 | $76,000 | $200,700 |
| 2016 | $3,968 | $228,600 | $72,400 | $156,200 |
| 2015 | $3,697 | $203,700 | $72,400 | $131,300 |
| 2014 | $3,296 | $181,800 | $72,400 | $109,400 |
Source: Public Records
Map
Nearby Homes