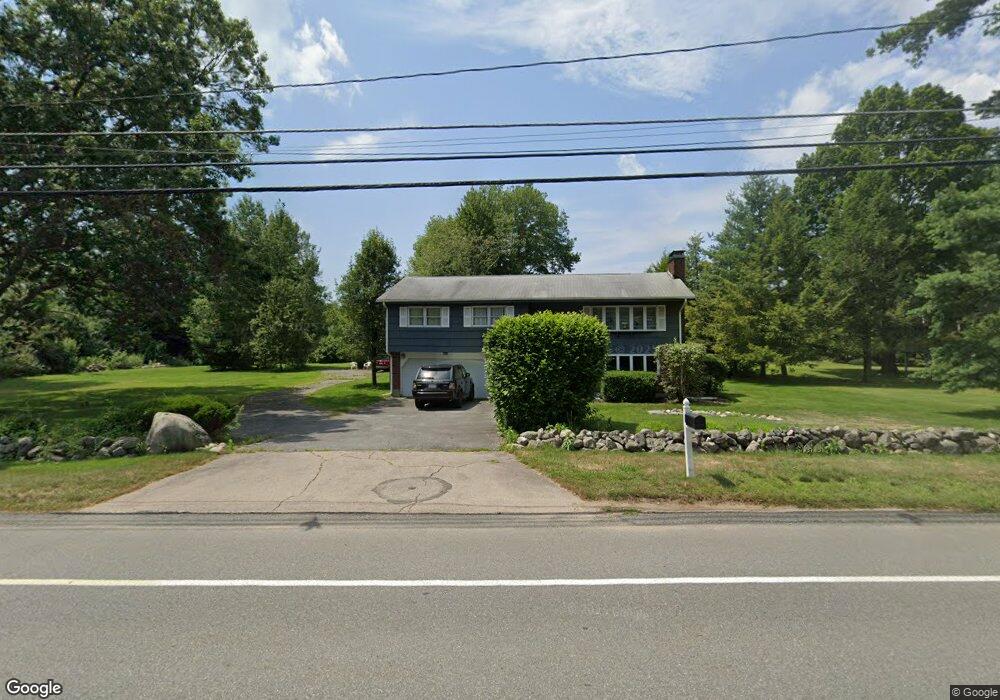
393 Fisher St Unit 393 Walpole, MA 02081
Estimated Value: $701,000 - $827,000
3
Beds
3
Baths
1,150
Sq Ft
$638/Sq Ft
Est. Value
About This Home
This home is located at 393 Fisher St Unit 393, Walpole, MA 02081 and is currently estimated at $734,109, approximately $638 per square foot. 393 Fisher St Unit 393 is a home located in Norfolk County with nearby schools including Fisher School, Walpole Middle School, and Walpole High School.
Ownership History
Date
Name
Owned For
Owner Type
Purchase Details
Closed on
Jul 20, 2012
Sold by
Cordopatri Nancy M
Bought by
Morley Kevin J
Current Estimated Value
Purchase Details
Closed on
Sep 30, 2005
Sold by
Plaut Bernard S and Plaut Laura B
Bought by
Cordopatri Nancy M
Home Financials for this Owner
Home Financials are based on the most recent Mortgage that was taken out on this home.
Original Mortgage
$272,000
Interest Rate
5.84%
Mortgage Type
Purchase Money Mortgage
Create a Home Valuation Report for This Property
The Home Valuation Report is an in-depth analysis detailing your home's value as well as a comparison with similar homes in the area
Home Values in the Area
Average Home Value in this Area
Purchase History
| Date | Buyer | Sale Price | Title Company |
|---|---|---|---|
| Morley Kevin J | $318,500 | -- | |
| Cordopatri Nancy M | $340,000 | -- |
Source: Public Records
Mortgage History
| Date | Status | Borrower | Loan Amount |
|---|---|---|---|
| Previous Owner | Cordopatri Nancy M | $272,000 |
Source: Public Records
Tax History Compared to Growth
Tax History
| Year | Tax Paid | Tax Assessment Tax Assessment Total Assessment is a certain percentage of the fair market value that is determined by local assessors to be the total taxable value of land and additions on the property. | Land | Improvement |
|---|---|---|---|---|
| 2025 | $7,949 | $619,600 | $350,600 | $269,000 |
| 2024 | $7,779 | $588,400 | $337,300 | $251,100 |
| 2023 | $7,421 | $534,300 | $293,200 | $241,100 |
| 2022 | $7,093 | $490,500 | $271,500 | $219,000 |
| 2021 | $6,828 | $460,100 | $256,300 | $203,800 |
| 2020 | $6,778 | $452,200 | $241,700 | $210,500 |
| 2019 | $6,565 | $434,800 | $232,400 | $202,400 |
| 2018 | $6,195 | $405,700 | $223,700 | $182,000 |
| 2017 | $5,970 | $389,400 | $215,000 | $174,400 |
| 2016 | $5,819 | $374,000 | $208,600 | $165,400 |
| 2015 | $5,619 | $357,900 | $199,700 | $158,200 |
| 2014 | $5,398 | $342,500 | $199,700 | $142,800 |
Source: Public Records
Map
Nearby Homes
- 1080 North St
- 66 Gould St
- 4 Lost Brook Trail
- 19 and 23 Arlington Ln
- 531 Walpole St
- 17 Bridle Path
- 22 Coolidge Rd
- 291 Plimpton St
- 52 Yarmouth Rd
- 23 Bubbling Brook Rd
- 634 Main St Unit 14
- 21 Spear Ave
- 18 Laurel Rd
- 70 Endicott St Unit 404
- 70 Endicott St Unit 1306
- 303 Oak St
- 44 Millbrook Ave
- 20 Rockhill St
- 10 Victoria Cir
- 20 Rockhill St