Estimated Value: $421,236 - $491,000
3
Beds
2
Baths
1,224
Sq Ft
$384/Sq Ft
Est. Value
About This Home
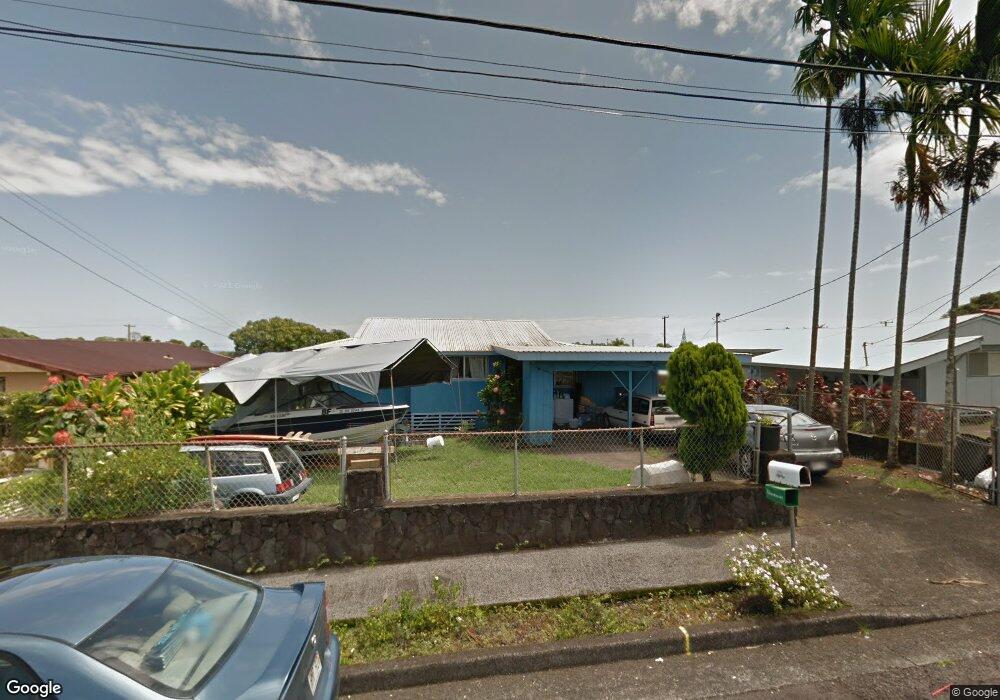
This home is located at 393 Hoopuni St, Hilo, HI 96720 and is currently estimated at $470,059, approximately $384 per square foot. 393 Hoopuni St is a home located in Hawaii County with nearby schools including Chiefess Kapiolani Elementary School, Hilo Intermediate School, and Hilo High School.
Ownership History
Date
Name
Owned For
Owner Type
Purchase Details
Closed on
May 15, 2003
Sold by
Corpuz Renny and Corpuz Felosofia
Bought by
Corpuz Gary and Corpuz Anne Louise
Current Estimated Value
Home Financials for this Owner
Home Financials are based on the most recent Mortgage that was taken out on this home.
Original Mortgage
$81,600
Interest Rate
5.77%
Mortgage Type
Purchase Money Mortgage
Purchase Details
Closed on
Jan 28, 2002
Sold by
Corpuz Renny and Corpuz Felosofia
Bought by
Corpuz Renny and Corpuz Felosofia
Create a Home Valuation Report for This Property
The Home Valuation Report is an in-depth analysis detailing your home's value as well as a comparison with similar homes in the area
Home Values in the Area
Average Home Value in this Area
Purchase History
| Date | Buyer | Sale Price | Title Company |
|---|---|---|---|
| Corpuz Gary | -- | -- | |
| Corpuz Renny | -- | Island Title Corp |
Source: Public Records
Mortgage History
| Date | Status | Borrower | Loan Amount |
|---|---|---|---|
| Closed | Corpuz Gary | $81,600 | |
| Closed | Corpuz Gary | $10,200 |
Source: Public Records
Tax History Compared to Growth
Tax History
| Year | Tax Paid | Tax Assessment Tax Assessment Total Assessment is a certain percentage of the fair market value that is determined by local assessors to be the total taxable value of land and additions on the property. | Land | Improvement |
|---|---|---|---|---|
| 2025 | $588 | $243,200 | $75,600 | $167,600 |
| 2024 | $588 | $236,100 | $75,600 | $160,500 |
| 2023 | $605 | $229,200 | $75,600 | $153,600 |
| 2022 | $603 | $222,500 | $75,600 | $146,900 |
| 2021 | $571 | $216,000 | $75,600 | $140,400 |
| 2020 | $540 | $209,700 | $75,600 | $134,100 |
| 2019 | $510 | $203,600 | $75,600 | $128,000 |
| 2018 | $727 | $197,700 | $75,600 | $122,100 |
| 2017 | $698 | $191,900 | $75,600 | $116,300 |
| 2016 | $670 | $186,300 | $75,600 | $110,700 |
| 2015 | $1,639 | $180,900 | $75,600 | $105,300 |
| 2014 | $1,639 | $181,300 | $75,600 | $105,700 |
Source: Public Records
Map
Nearby Homes