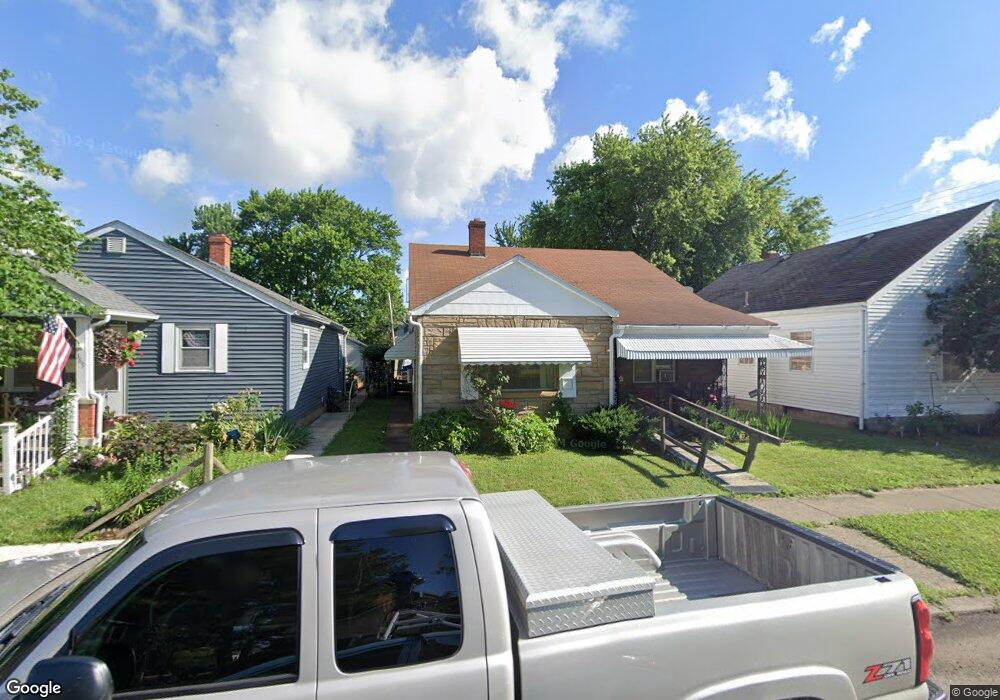
393 Mckellar St Chillicothe, OH 45601
Estimated Value: $102,000 - $147,831
4
Beds
1
Bath
1,853
Sq Ft
$68/Sq Ft
Est. Value
About This Home
This home is located at 393 Mckellar St, Chillicothe, OH 45601 and is currently estimated at $125,458, approximately $67 per square foot. 393 Mckellar St is a home located in Ross County with nearby schools including Chillicothe High School, Bishop Flaget School, and Wesley Taylor Preparatory School.
Ownership History
Date
Name
Owned For
Owner Type
Purchase Details
Closed on
Nov 9, 2017
Sold by
Albright Gary A and Hess Glennadine M
Bought by
Wright James V and Wright Karen
Current Estimated Value
Home Financials for this Owner
Home Financials are based on the most recent Mortgage that was taken out on this home.
Original Mortgage
$48,015
Outstanding Balance
$40,213
Interest Rate
3.83%
Mortgage Type
New Conventional
Estimated Equity
$85,245
Purchase Details
Closed on
Jun 20, 2012
Sold by
Mahoney Bernice M
Bought by
Albright Gary A and Hess Glennadine M
Create a Home Valuation Report for This Property
The Home Valuation Report is an in-depth analysis detailing your home's value as well as a comparison with similar homes in the area
Home Values in the Area
Average Home Value in this Area
Purchase History
| Date | Buyer | Sale Price | Title Company |
|---|---|---|---|
| Wright James V | $12,375 | None Available | |
| Albright Gary A | -- | None Available |
Source: Public Records
Mortgage History
| Date | Status | Borrower | Loan Amount |
|---|---|---|---|
| Open | Wright James V | $48,015 |
Source: Public Records
Tax History Compared to Growth
Tax History
| Year | Tax Paid | Tax Assessment Tax Assessment Total Assessment is a certain percentage of the fair market value that is determined by local assessors to be the total taxable value of land and additions on the property. | Land | Improvement |
|---|---|---|---|---|
| 2024 | $1,352 | $33,910 | $3,030 | $30,880 |
| 2023 | $1,352 | $33,910 | $3,030 | $30,880 |
| 2022 | $1,376 | $33,910 | $3,030 | $30,880 |
| 2021 | $1,263 | $27,280 | $2,730 | $24,550 |
| 2020 | $1,263 | $27,280 | $2,730 | $24,550 |
| 2019 | $1,264 | $27,280 | $2,730 | $24,550 |
| 2018 | $1,412 | $28,890 | $2,730 | $26,160 |
| 2017 | $1,557 | $28,890 | $2,730 | $26,160 |
| 2016 | $1,542 | $28,890 | $2,730 | $26,160 |
| 2015 | $1,440 | $26,320 | $2,730 | $23,590 |
| 2014 | $1,413 | $26,320 | $2,730 | $23,590 |
| 2013 | $1,415 | $26,320 | $2,730 | $23,590 |
Source: Public Records
Map
Nearby Homes