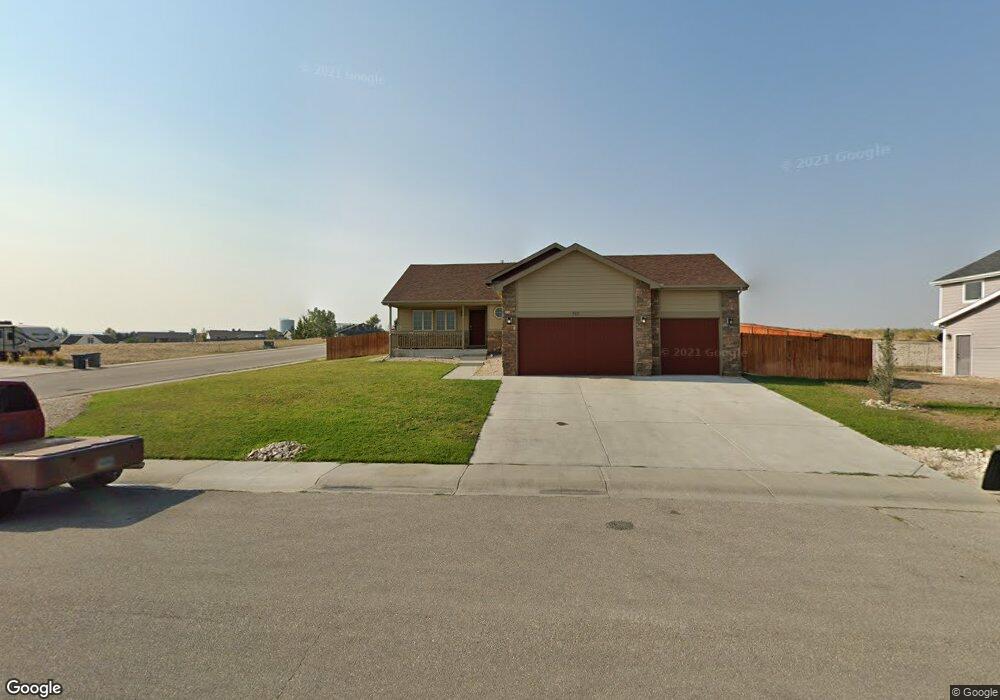
393 Miller Rd Unit Sunup Glenrock, WY 82637
Estimated Value: $51,000 - $382,000
4
Beds
3
Baths
2,086
Sq Ft
$137/Sq Ft
Est. Value
About This Home
This home is located at 393 Miller Rd Unit Sunup, Glenrock, WY 82637 and is currently estimated at $286,554, approximately $137 per square foot. 393 Miller Rd Unit Sunup is a home located in Converse County with nearby schools including Grant Elementary School, Glenrock Intermediate School, and Boxelder Elementary.
Ownership History
Date
Name
Owned For
Owner Type
Purchase Details
Closed on
Mar 22, 2023
Sold by
Nelson Blake and Nelson Brittany
Bought by
Yocum Levi
Current Estimated Value
Home Financials for this Owner
Home Financials are based on the most recent Mortgage that was taken out on this home.
Original Mortgage
$201,279
Outstanding Balance
$192,145
Interest Rate
4%
Mortgage Type
VA
Estimated Equity
$94,409
Purchase Details
Closed on
Dec 13, 2018
Sold by
Pennymac Loan Services Llc
Bought by
Nelson Blake and Nelson Brittany
Home Financials for this Owner
Home Financials are based on the most recent Mortgage that was taken out on this home.
Original Mortgage
$220,924
Interest Rate
4.8%
Mortgage Type
FHA
Purchase Details
Closed on
Sep 10, 2018
Sold by
Nickell Nathaniel Lane and Nickell Rachel S
Bought by
Pennymac Loan Services Llc
Create a Home Valuation Report for This Property
The Home Valuation Report is an in-depth analysis detailing your home's value as well as a comparison with similar homes in the area
Home Values in the Area
Average Home Value in this Area
Purchase History
| Date | Buyer | Sale Price | Title Company |
|---|---|---|---|
| Yocum Levi | -- | -- | |
| Nelson Blake | -- | None Available | |
| Pennymac Loan Services Llc | $208,260 | None Available |
Source: Public Records
Mortgage History
| Date | Status | Borrower | Loan Amount |
|---|---|---|---|
| Open | Yocum Levi | $201,279 | |
| Previous Owner | Nelson Blake | $220,924 |
Source: Public Records
Tax History Compared to Growth
Tax History
| Year | Tax Paid | Tax Assessment Tax Assessment Total Assessment is a certain percentage of the fair market value that is determined by local assessors to be the total taxable value of land and additions on the property. | Land | Improvement |
|---|---|---|---|---|
| 2025 | $2,482 | $24,652 | $3,296 | $21,356 |
| 2024 | $2,482 | $33,615 | $4,262 | $29,353 |
| 2023 | $2,254 | $30,359 | $4,131 | $26,228 |
| 2022 | $2,046 | $27,803 | $3,955 | $23,848 |
| 2021 | $1,875 | $25,046 | $3,515 | $21,531 |
| 2020 | $1,775 | $24,232 | $3,515 | $20,717 |
| 2019 | $1,832 | $24,682 | $3,076 | $21,606 |
| 2018 | $1,680 | $23,437 | $3,076 | $20,361 |
| 2017 | $1,727 | $23,595 | $3,076 | $20,519 |
| 2015 | $1,693 | $22,798 | $2,900 | $19,898 |
| 2014 | $1,585 | $21,304 | $2,900 | $18,404 |
Source: Public Records
Map
Nearby Homes
- 382 Miller Rd
- 409 Claim Draw
- Lot 12 Sunup Rd
- 562 Emigrant Dr
- 556 Emigrant Dr
- 550 Emigrant Dr
- 502 Emigrant Dr
- 526 Emigrant Dr
- 514 Emigrant Dr
- 508 Emigrant Dr
- 532 Emigrant Dr
- 538 Emigrant Dr
- 544 Emigrant Dr
- 520 Emigrant Dr
- 532 Windmill Rd
- 400 Sunshine Ln
- 312 S 2nd St
- Lot 4 Grove St
- Lot 8 John Butler Dr
- Lot 1 Grove St
- 393 Miller Rd
- 385 Miller Rd
- 390 Miller Rd Unit Williams Way
- 210 Sunset Rd
- 382 Miller Rd Unit Sunset
- 377 Miller Rd
- 130 Sunset Rd
- 391 Williams Way
- 415 Miller Rd
- 213 Claim Dr
- 120 Sunset Rd
- 120 Sunset Rd Unit Williams Way
- 369 Miller Rd
- 310 Sunset Rd
- 375 Williams Way
- 366 Miller Rd
- 367 Williams Way
- 367 Williams Way Unit Sunset Rd OR Miller
- 110 Sunset Rd
- 388 Williams Way