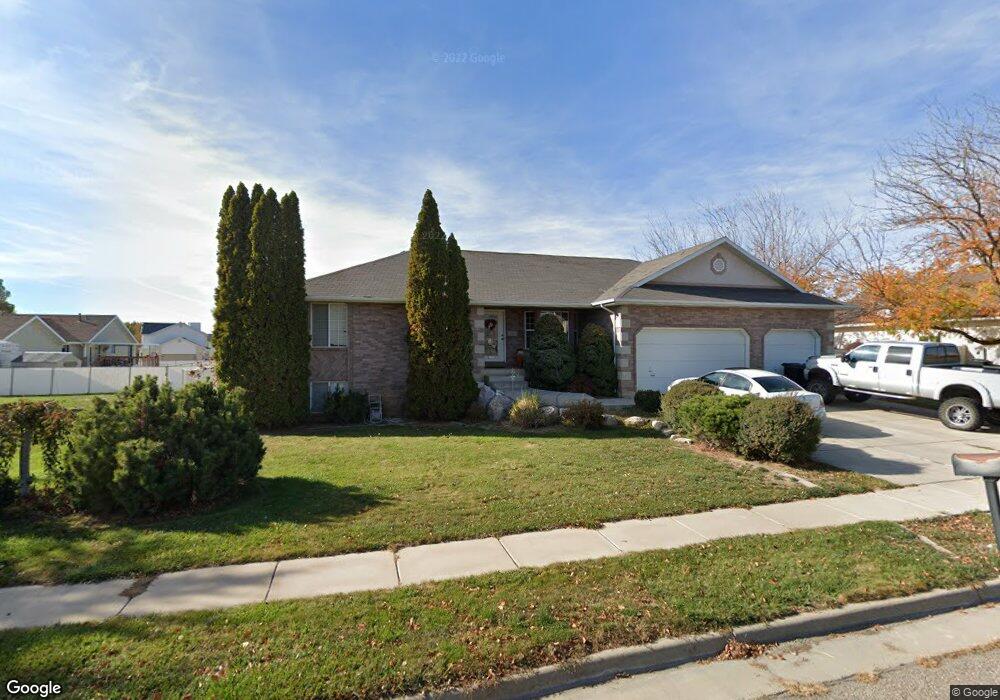
393 N 1875 W Clearfield, UT 84015
Estimated Value: $572,000 - $633,000
6
Beds
4
Baths
3,629
Sq Ft
$163/Sq Ft
Est. Value
About This Home
This home is located at 393 N 1875 W, Clearfield, UT 84015 and is currently estimated at $592,943, approximately $163 per square foot. 393 N 1875 W is a home located in Davis County with nearby schools including Lakeside School, West Point Junior High School, and Syracuse High School.
Ownership History
Date
Name
Owned For
Owner Type
Purchase Details
Closed on
Nov 8, 2012
Sold by
Martinez Orlando and Martinez Lori J
Bought by
Martinez Orlando C
Current Estimated Value
Home Financials for this Owner
Home Financials are based on the most recent Mortgage that was taken out on this home.
Original Mortgage
$272,300
Outstanding Balance
$187,042
Interest Rate
3.34%
Mortgage Type
New Conventional
Estimated Equity
$405,901
Purchase Details
Closed on
May 30, 2008
Sold by
Larsen Monte J and Larsen Julie A
Bought by
Martinez Orlando and Martinez Lori Jeanne
Home Financials for this Owner
Home Financials are based on the most recent Mortgage that was taken out on this home.
Original Mortgage
$285,000
Interest Rate
5.87%
Mortgage Type
Purchase Money Mortgage
Purchase Details
Closed on
Jan 3, 1997
Sold by
Eagle Enterprises Inc
Bought by
Larsen Monte J and Larsen Julie A
Purchase Details
Closed on
Feb 27, 1996
Sold by
Frew Estates Ltd Partnership
Bought by
Eagle Enterprises Inc
Create a Home Valuation Report for This Property
The Home Valuation Report is an in-depth analysis detailing your home's value as well as a comparison with similar homes in the area
Home Values in the Area
Average Home Value in this Area
Purchase History
| Date | Buyer | Sale Price | Title Company |
|---|---|---|---|
| Martinez Orlando C | -- | Backman Title Svcs | |
| Martinez Orlando | -- | First American Title | |
| Larsen Monte J | -- | Bonneville Title Company Inc | |
| Eagle Enterprises Inc | -- | Bonneville Title Company Inc |
Source: Public Records
Mortgage History
| Date | Status | Borrower | Loan Amount |
|---|---|---|---|
| Open | Martinez Orlando C | $272,300 | |
| Previous Owner | Martinez Orlando | $285,000 |
Source: Public Records
Tax History Compared to Growth
Tax History
| Year | Tax Paid | Tax Assessment Tax Assessment Total Assessment is a certain percentage of the fair market value that is determined by local assessors to be the total taxable value of land and additions on the property. | Land | Improvement |
|---|---|---|---|---|
| 2025 | $3,398 | $318,450 | $105,148 | $213,302 |
| 2024 | $3,243 | $305,250 | $94,702 | $210,548 |
| 2023 | $3,015 | $522,000 | $115,742 | $406,258 |
| 2022 | $3,267 | $309,650 | $59,572 | $250,078 |
| 2021 | $2,962 | $420,000 | $95,551 | $324,449 |
| 2020 | $2,573 | $360,000 | $79,816 | $280,184 |
| 2019 | $2,508 | $346,000 | $77,572 | $268,428 |
| 2018 | $2,272 | $309,000 | $78,580 | $230,420 |
| 2016 | $2,002 | $143,275 | $30,360 | $112,915 |
| 2015 | $1,996 | $135,300 | $30,360 | $104,940 |
| 2014 | $1,844 | $126,778 | $30,360 | $96,418 |
| 2013 | -- | $109,460 | $29,469 | $79,991 |
Source: Public Records
Map
Nearby Homes
- 1774 W 400 N
- 607 N 2000 W
- 1805 W 675 N
- 1652 W 560 N
- 1832 W 725 N
- 1827 W 775 N
- 47 N 1750 W
- 12 N 2000 W Unit 1
- 2283 W 470 N
- 575 N 1350 W Unit 137
- 1350 W 300 N Unit 49
- 1350 W 300 N Unit 38
- 1350 W 300 N Unit 29
- 2132 W 800 N
- 1828 W 75 S
- 563 N 1350 W Unit 139
- 1337 W 550 N Unit 195
- 1648 W 150 S
- 2348 W 800 N
- 423 N 1250 W Unit 118