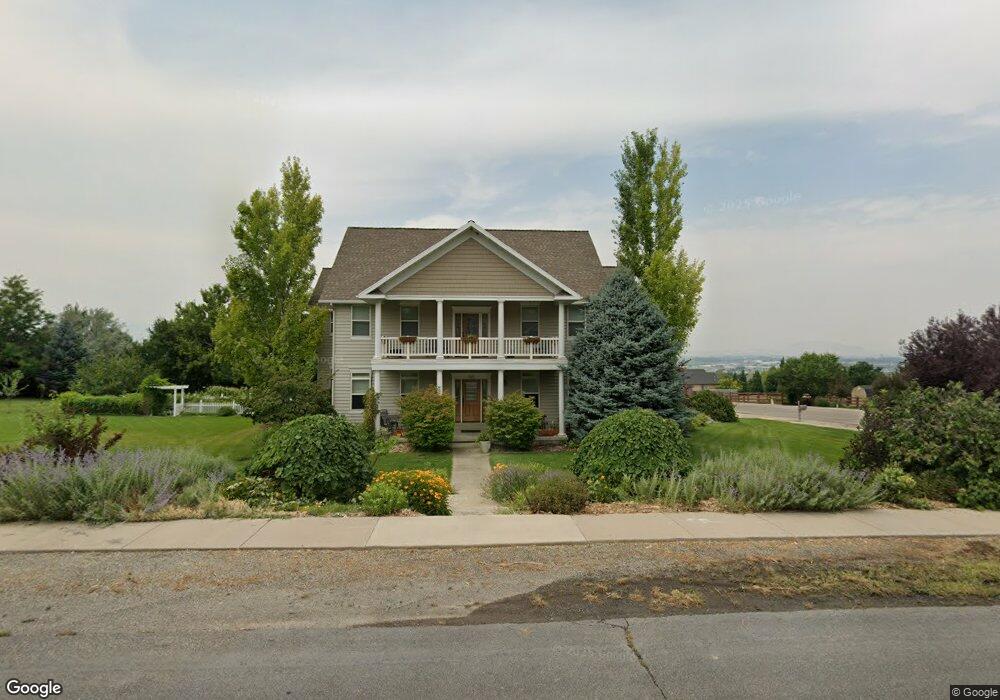
393 N 600 E Hyde Park, UT 84318
Estimated Value: $730,000 - $1,032,000
6
Beds
4
Baths
5,180
Sq Ft
$179/Sq Ft
Est. Value
About This Home
This home is located at 393 N 600 E, Hyde Park, UT 84318 and is currently estimated at $924,757, approximately $178 per square foot. 393 N 600 E is a home located in Cache County with nearby schools including North Park School, Cedar Ridge School, and North Cache Middle School.
Ownership History
Date
Name
Owned For
Owner Type
Purchase Details
Closed on
Aug 14, 2023
Sold by
Mckay Dustin William and Mckay Rebecca Dawn
Bought by
Dustin And Rebecca Mckay Trust and Mckay
Current Estimated Value
Purchase Details
Closed on
Apr 17, 2015
Sold by
Marshall Scott A and Marshall Patricia D
Bought by
The Marshall Family Trust and Marshall Patricia Davis
Purchase Details
Closed on
Jan 30, 2007
Sold by
Corbridge Development Lc
Bought by
Marshall Scott A and Marshall Patricia D
Home Financials for this Owner
Home Financials are based on the most recent Mortgage that was taken out on this home.
Original Mortgage
$338,400
Interest Rate
6.1%
Mortgage Type
New Conventional
Create a Home Valuation Report for This Property
The Home Valuation Report is an in-depth analysis detailing your home's value as well as a comparison with similar homes in the area
Home Values in the Area
Average Home Value in this Area
Purchase History
| Date | Buyer | Sale Price | Title Company |
|---|---|---|---|
| Dustin And Rebecca Mckay Trust | -- | None Listed On Document | |
| The Marshall Family Trust | -- | Northern Title Company | |
| Marshall Scott A | -- | Northern Title Company |
Source: Public Records
Mortgage History
| Date | Status | Borrower | Loan Amount |
|---|---|---|---|
| Previous Owner | Marshall Scott A | $338,400 |
Source: Public Records
Tax History
| Year | Tax Paid | Tax Assessment Tax Assessment Total Assessment is a certain percentage of the fair market value that is determined by local assessors to be the total taxable value of land and additions on the property. | Land | Improvement |
|---|---|---|---|---|
| 2025 | $370 | $509,555 | $0 | $0 |
| 2024 | $4,116 | $523,230 | $0 | $0 |
| 2023 | $4,290 | $518,755 | $0 | $0 |
| 2022 | $4,461 | $518,760 | $0 | $0 |
| 2021 | $4,238 | $774,065 | $97,550 | $676,515 |
| 2020 | $3,245 | $563,576 | $97,550 | $466,026 |
| 2019 | $3,419 | $563,576 | $97,550 | $466,026 |
| 2018 | $3,006 | $485,790 | $80,550 | $405,240 |
| 2017 | $2,902 | $246,925 | $0 | $0 |
| 2016 | $2,944 | $246,925 | $0 | $0 |
| 2015 | $2,655 | $225,040 | $0 | $0 |
| 2014 | $2,587 | $225,040 | $0 | $0 |
| 2013 | -- | $225,040 | $0 | $0 |
Source: Public Records
Map
Nearby Homes
- 458 W Madison St S
- 1130 E 245 N
- 201 N 1000 E Unit 19
- 1109 E 245 N
- 830 E 410 N Unit 161
- 635 S 125 E Unit 120
- 454 W Madison St S
- 1070 E 200 N Unit 24
- 480 N 729 E
- 640 S 175 E
- 150 E 650 S Unit 108
- 626 S 125 E
- 613 S 175 E
- 623 S 125 E
- 375 N 400 E
- 1087 E 160 N
- 898 E 260 N
- 128 N 900 E
- 522 N 800 E
- 116 N 820 E
Your Personal Tour Guide
Ask me questions while you tour the home.