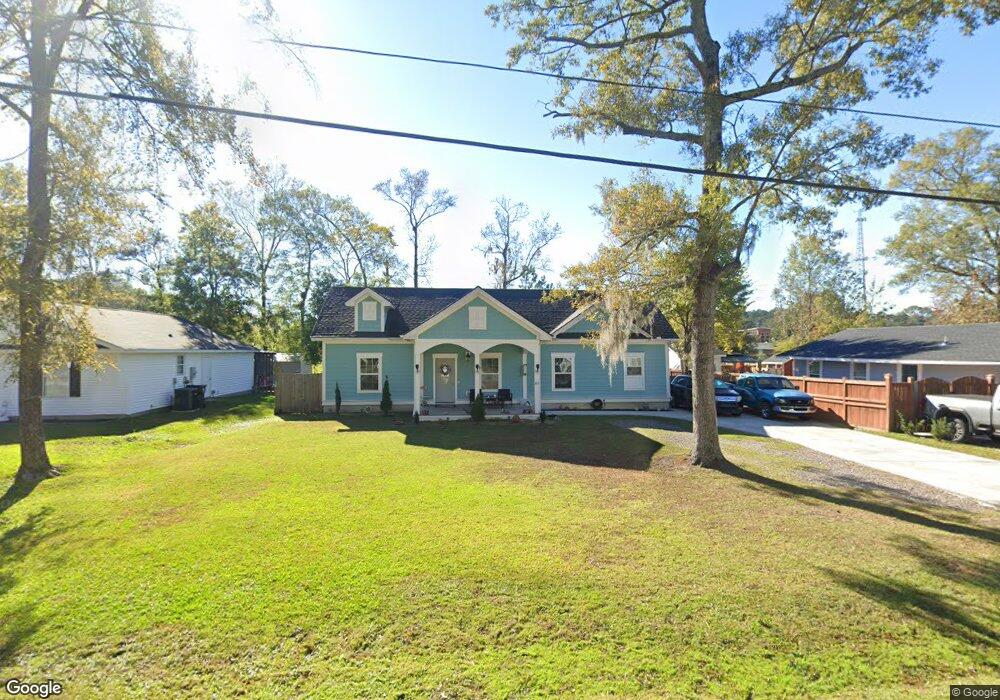
393 Price St Goose Creek, SC 29445
Estimated Value: $279,000 - $325,000
3
Beds
1
Bath
1,300
Sq Ft
$231/Sq Ft
Est. Value
About This Home
This home is located at 393 Price St, Goose Creek, SC 29445 and is currently estimated at $300,470, approximately $231 per square foot. 393 Price St is a home located in Berkeley County with nearby schools including Goose Creek Primary School, Sedgefield Middle School, and Goose Creek High School.
Ownership History
Date
Name
Owned For
Owner Type
Purchase Details
Closed on
Mar 20, 2017
Sold by
Conrex Residential Property Group 2012 2
Bought by
Escobar Jesus Rulvalcaba
Current Estimated Value
Purchase Details
Closed on
Feb 7, 2014
Sold by
Conrex Residential Property Group 2012 & 2
Bought by
Conrex Residential Property Group 2012 & 2
Purchase Details
Closed on
May 9, 2013
Sold by
Vision Real Estate Company Llc
Bought by
Conrex Residential Property Group 2012 & 2
Purchase Details
Closed on
Feb 20, 2013
Sold by
Eh Pooled 1212 Lp
Bought by
Vision Real Estate Company Llc
Purchase Details
Closed on
Jan 19, 2013
Sold by
Deutsche Bank National Trust Company
Bought by
Eh Pooled 1212 Lp
Purchase Details
Closed on
Oct 11, 2012
Sold by
Leighton Leslie A and Leighton Douglas
Bought by
Deutsche Bank National Trust Company
Purchase Details
Closed on
Mar 1, 2000
Sold by
Gates Alice B
Bought by
Leighton Leslie A and Leighton Douglas
Create a Home Valuation Report for This Property
The Home Valuation Report is an in-depth analysis detailing your home's value as well as a comparison with similar homes in the area
Home Values in the Area
Average Home Value in this Area
Purchase History
| Date | Buyer | Sale Price | Title Company |
|---|---|---|---|
| Escobar Jesus Rulvalcaba | $20,000 | None Available | |
| Conrex Residential Property Group 2012 & 2 | -- | -- | |
| Conrex Residential Property Group 2012 & 2 | $30,000 | -- | |
| Vision Real Estate Company Llc | $19,202 | -- | |
| Eh Pooled 1212 Lp | $627 | -- | |
| Deutsche Bank National Trust Company | $20,498 | -- | |
| Leighton Leslie A | $55,000 | -- |
Source: Public Records
Tax History Compared to Growth
Tax History
| Year | Tax Paid | Tax Assessment Tax Assessment Total Assessment is a certain percentage of the fair market value that is determined by local assessors to be the total taxable value of land and additions on the property. | Land | Improvement |
|---|---|---|---|---|
| 2025 | $3,507 | $222,180 | $40,372 | $181,808 |
| 2024 | $3,507 | $13,330 | $2,422 | $10,908 |
| 2023 | $3,507 | $13,330 | $2,422 | $10,908 |
| 2022 | $3,363 | $11,592 | $1,500 | $10,092 |
| 2021 | $3,388 | $11,590 | $1,500 | $10,092 |
| 2020 | $3,400 | $11,592 | $1,500 | $10,092 |
| 2019 | $3,393 | $11,592 | $1,500 | $10,092 |
| 2018 | $440 | $1,500 | $1,500 | $0 |
| 2017 | $268 | $900 | $900 | $0 |
| 2016 | $1,352 | $900 | $900 | $0 |
| 2015 | $1,295 | $4,030 | $900 | $3,130 |
| 2014 | $3,121 | $5,360 | $900 | $4,460 |
| 2013 | -- | $5,360 | $900 | $4,460 |
Source: Public Records
Map
Nearby Homes
- 138 Cannon Ave
- 140 Weeks Ave
- 113 The Oaks Ave
- 113 Harvey Ave
- 103 Keenan Ave
- 109 Harvey Ave
- 112 Goose Creek Dr
- 119 The Oaks Ave
- 203 Harding Ln
- 205 Harding Ln
- 207 Harding Ln
- 209 Harding Ln
- Aspen Plan at The Oaks
- Sago Plan at The Oaks
- Juniper II Plan at The Oaks
- Ivy Plan at The Oaks
- 211 Harding Ln
- 215 Harding Ln
- 217 Harding Ln
- Millstream III Plan at Lakeview Commons - Townhomes