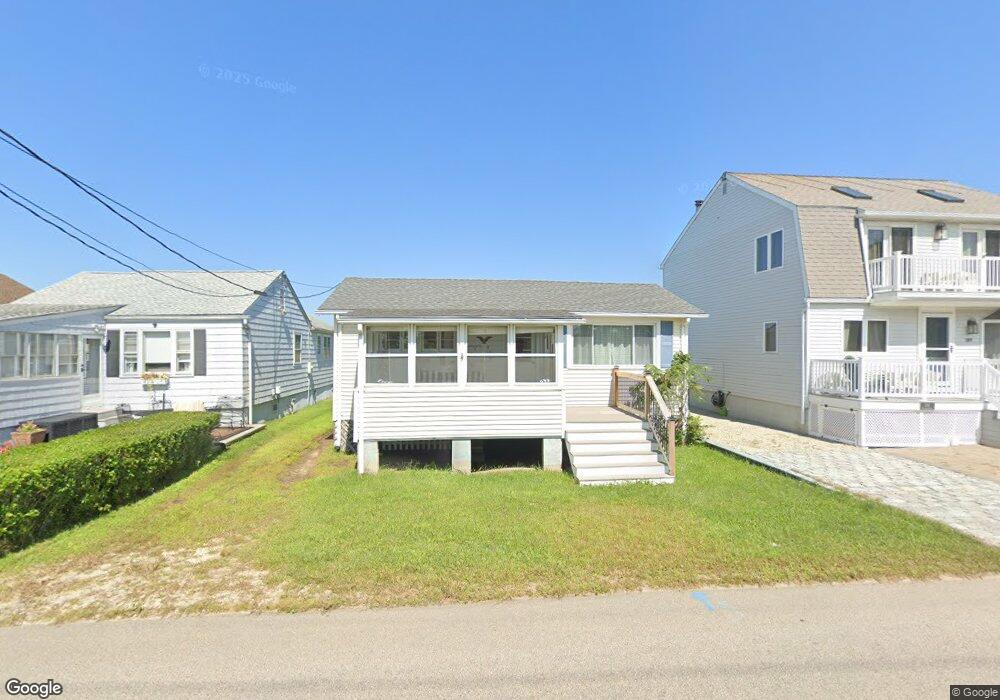
393 Seaside Ave Westbrook, CT 06498
Estimated Value: $470,386 - $756,000
3
Beds
3
Baths
690
Sq Ft
$920/Sq Ft
Est. Value
About This Home
This home is located at 393 Seaside Ave, Westbrook, CT 06498 and is currently estimated at $634,847, approximately $920 per square foot. 393 Seaside Ave is a home located in Middlesex County with nearby schools including Daisy Ingraham School, Westbrook Middle School, and Westbrook High School.
Ownership History
Date
Name
Owned For
Owner Type
Purchase Details
Closed on
Sep 28, 2019
Sold by
Post Wayne D and Post Yvonne M
Bought by
Ackley John E and Destefano Lisa M
Current Estimated Value
Home Financials for this Owner
Home Financials are based on the most recent Mortgage that was taken out on this home.
Original Mortgage
$365,700
Outstanding Balance
$320,372
Interest Rate
3.5%
Mortgage Type
New Conventional
Estimated Equity
$314,475
Create a Home Valuation Report for This Property
The Home Valuation Report is an in-depth analysis detailing your home's value as well as a comparison with similar homes in the area
Home Values in the Area
Average Home Value in this Area
Purchase History
| Date | Buyer | Sale Price | Title Company |
|---|---|---|---|
| Ackley John E | $387,300 | -- |
Source: Public Records
Mortgage History
| Date | Status | Borrower | Loan Amount |
|---|---|---|---|
| Open | Ackley John E | $365,700 |
Source: Public Records
Tax History
| Year | Tax Paid | Tax Assessment Tax Assessment Total Assessment is a certain percentage of the fair market value that is determined by local assessors to be the total taxable value of land and additions on the property. | Land | Improvement |
|---|---|---|---|---|
| 2025 | $5,192 | $230,770 | $194,600 | $36,170 |
| 2024 | $5,008 | $230,770 | $194,600 | $36,170 |
| 2023 | $4,920 | $230,770 | $194,600 | $36,170 |
| 2022 | $4,791 | $230,770 | $194,600 | $36,170 |
| 2021 | $3,984 | $159,350 | $127,620 | $31,730 |
| 2020 | $3,984 | $159,350 | $127,620 | $31,730 |
| 2019 | $3,931 | $159,350 | $127,620 | $31,730 |
| 2018 | $3,883 | $159,350 | $127,620 | $31,730 |
| 2017 | $3,883 | $159,350 | $127,620 | $31,730 |
| 2016 | $5,329 | $230,290 | $195,200 | $35,090 |
| 2015 | $5,184 | $230,290 | $195,200 | $35,090 |
| 2014 | $5,018 | $230,290 | $195,200 | $35,090 |
Source: Public Records
Map
Nearby Homes
- 0 Boston Post Rd Unit 24080344
- 40 Hammock Rd S
- 328 Hammock Rd N
- 951 Old Clinton Rd Unit 15
- 41 Trolley Rd
- 29 Salt Island Rd
- 86 Grove Beach Rd N
- 11a/11b Pond Circle Rd
- 44 Linden Ave N
- 5 Meadow Point Rd
- 407 Grove Beach Rd N
- 85 McVeagh Rd
- 40 Beach Rd
- 19 Old Forge Rd
- 37 Nolin Rd
- 0 Causeway
- 176 Shore Rd
- 167 Shore Rd
- 8 Cook Terrace
- 39 Sagamore Terrace Rd
- 389 Seaside Ave
- 397 Seaside Ave
- 385 Seaside Ave
- 401 Seaside Ave
- 405 Seaside Ave
- 409 Seaside Ave
- 373 Seaside Ave
- 413 Seaside Ave
- 369 Seaside Ave
- 365 Seaside Ave
- 421 Seaside Ave
- 361 Seaside Ave
- 357 Seaside Ave
- 349 Seaside Ave
- 8 Tarpon Ave
- 439 Seaside Ave
- 12 Tarpon Ave
- 18 Tarpon Ave
- 438 Seaside Ave
- 345 Seaside Ave
Your Personal Tour Guide
Ask me questions while you tour the home.