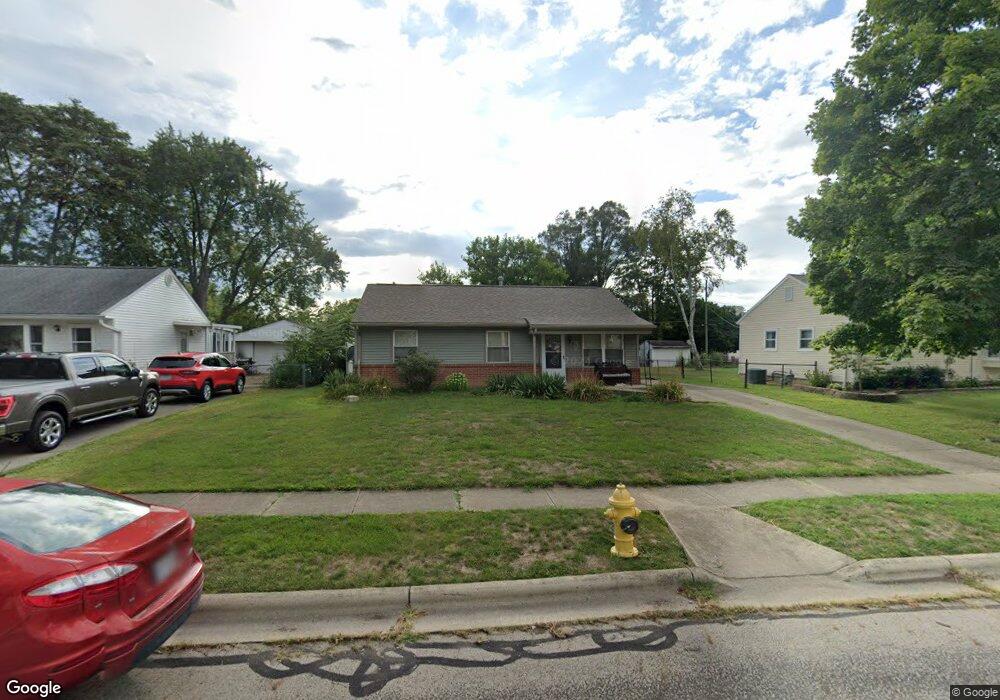
393 Sheryl Dr Groveport, OH 43125
Estimated Value: $214,000 - $257,000
3
Beds
1
Bath
1,181
Sq Ft
$198/Sq Ft
Est. Value
About This Home
This home is located at 393 Sheryl Dr, Groveport, OH 43125 and is currently estimated at $234,344, approximately $198 per square foot. 393 Sheryl Dr is a home located in Franklin County with nearby schools including Groveport Madison High School, Groveport Community School, and Madison Christian School.
Ownership History
Date
Name
Owned For
Owner Type
Purchase Details
Closed on
Oct 17, 2018
Sold by
Nichols Kristy S and Nichols Joseph
Bought by
Westcamp Mollie
Current Estimated Value
Home Financials for this Owner
Home Financials are based on the most recent Mortgage that was taken out on this home.
Original Mortgage
$70,400
Outstanding Balance
$61,524
Interest Rate
4.6%
Mortgage Type
New Conventional
Estimated Equity
$172,820
Create a Home Valuation Report for This Property
The Home Valuation Report is an in-depth analysis detailing your home's value as well as a comparison with similar homes in the area
Home Values in the Area
Average Home Value in this Area
Purchase History
| Date | Buyer | Sale Price | Title Company |
|---|---|---|---|
| Westcamp Mollie | $88,000 | None Available |
Source: Public Records
Mortgage History
| Date | Status | Borrower | Loan Amount |
|---|---|---|---|
| Open | Westcamp Mollie | $70,400 |
Source: Public Records
Tax History Compared to Growth
Tax History
| Year | Tax Paid | Tax Assessment Tax Assessment Total Assessment is a certain percentage of the fair market value that is determined by local assessors to be the total taxable value of land and additions on the property. | Land | Improvement |
|---|---|---|---|---|
| 2024 | $3,126 | $63,920 | $22,370 | $41,550 |
| 2023 | $3,098 | $63,910 | $22,365 | $41,545 |
| 2022 | $2,223 | $36,580 | $9,210 | $27,370 |
| 2021 | $2,231 | $36,580 | $9,210 | $27,370 |
| 2020 | $2,236 | $36,580 | $9,210 | $27,370 |
| 2019 | $2,122 | $30,600 | $7,670 | $22,930 |
| 2018 | $2,243 | $30,600 | $7,670 | $22,930 |
| 2017 | $2,188 | $30,600 | $7,670 | $22,930 |
| 2016 | $2,283 | $28,990 | $7,390 | $21,600 |
| 2015 | $2,303 | $28,990 | $7,390 | $21,600 |
| 2014 | $2,172 | $28,990 | $7,390 | $21,600 |
| 2013 | $677 | $30,485 | $7,770 | $22,715 |
Source: Public Records
Map
Nearby Homes