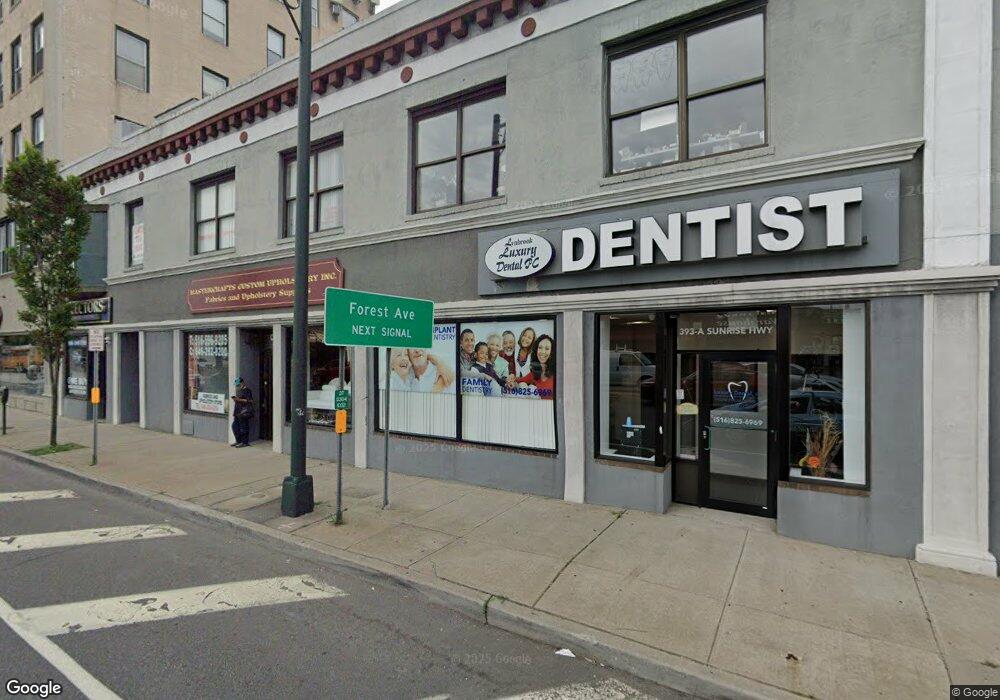
393 Sunrise Hwy Lynbrook, NY 11563
Estimated Value: $2,362,000
--
Bed
--
Bath
14,465
Sq Ft
$163/Sq Ft
Est. Value
About This Home
This home is located at 393 Sunrise Hwy, Lynbrook, NY 11563 and is currently estimated at $2,362,000, approximately $163 per square foot. 393 Sunrise Hwy is a home located in Nassau County with nearby schools including Lynbrook Senior High School and Our Lady Of Peace School.
Ownership History
Date
Name
Owned For
Owner Type
Purchase Details
Closed on
Nov 17, 2023
Sold by
Jonihylin Realty Management Corp
Bought by
Shiny Properties Inc
Current Estimated Value
Purchase Details
Closed on
Aug 16, 2018
Sold by
393 Sunrise Llc
Bought by
Jonhylin Realty Management Corp
Purchase Details
Closed on
Mar 12, 2012
Sold by
The Romanelli Family Limited Partnership
Bought by
Nu Pace Realty
Purchase Details
Closed on
Aug 28, 1998
Sold by
Romanelli Nicolina
Bought by
The Romanelli Family Lp
Create a Home Valuation Report for This Property
The Home Valuation Report is an in-depth analysis detailing your home's value as well as a comparison with similar homes in the area
Home Values in the Area
Average Home Value in this Area
Purchase History
| Date | Buyer | Sale Price | Title Company |
|---|---|---|---|
| Shiny Properties Inc | $2,282,500 | Stewart Title Insurance Co | |
| Shiny Properties Inc | $2,282,500 | Stewart Title Insurance Co | |
| Shiny Properties Inc | $2,282,500 | Stewart Title Insurance Co | |
| Jonhylin Realty Management Corp | $1,500,000 | None Available | |
| Jonhylin Realty Management Corp | $1,500,000 | None Available | |
| Jonhylin Realty Management Corp | $1,500,000 | None Available | |
| Nu Pace Realty | $950,000 | Not Available | |
| Nu Pace Realty | $950,000 | Not Available | |
| The Romanelli Family Lp | -- | -- | |
| The Romanelli Family Lp | -- | -- |
Source: Public Records
Tax History Compared to Growth
Tax History
| Year | Tax Paid | Tax Assessment Tax Assessment Total Assessment is a certain percentage of the fair market value that is determined by local assessors to be the total taxable value of land and additions on the property. | Land | Improvement |
|---|---|---|---|---|
| 2025 | $65,032 | $11,700 | $1,559 | $10,141 |
| 2024 | $5,591 | $11,700 | $1,559 | $10,141 |
| 2023 | $56,358 | $11,700 | $1,559 | $10,141 |
| 2022 | $56,358 | $11,700 | $1,559 | $10,141 |
| 2021 | $79,343 | $11,548 | $1,559 | $9,989 |
| 2020 | $53,317 | $6,865 | $1,521 | $5,344 |
| 2019 | $7,047 | $6,865 | $1,521 | $5,344 |
| 2018 | $43,958 | $8,315 | $0 | $0 |
| 2017 | $47,474 | $8,315 | $1,545 | $6,770 |
| 2016 | $59,467 | $9,915 | $1,842 | $8,073 |
| 2015 | $7,704 | $9,915 | $1,842 | $8,073 |
| 2014 | $7,704 | $9,915 | $1,842 | $8,073 |
| 2013 | $6,958 | $9,915 | $1,842 | $8,073 |
Source: Public Records
Map
Nearby Homes
- 114 Atlantic Ave Unit 89
- 21 Carter Ct
- 108 Earle Ave
- 183 Atlantic Ave Unit 2
- 183 Atlantic Ave Unit 8
- 65 Earle Ave
- 185 Atlantic Ave Unit C-1
- 185 Atlantic Ave Unit C-3
- 40 Daley Place Unit 124
- 85 Oakland Ave
- 200 Atlantic Ave Unit 223
- 200 Atlantic Ave Unit 212
- 200 Atlantic Ave Unit 321
- 20 Daley Place Unit 128
- 30 Daley Place Unit 247
- 20 Daley Place Unit 104
- 20 Daley Place Unit 225
- 30 Daley Place Unit 146
- 20 Daley Place Unit 127
- 2 Fowler Ave Unit 206
- 393 Sunrise Hwy Unit 4
- 393 Sunrise Hwy Unit 3
- 393 Sunrise Hwy Unit A
- 393 Sunrise Hwy Unit 2
- 393 Sunrise Hwy Unit 1
- 393 Sunrise Hwy Unit B
- 393 Sunrise Hwy Unit Ofc 1
- 393 Sunrise Hwy Unit Ofc 2
- 381 Sunrise Hwy
- 381 Sunrise Hwy Unit 7
- 68-72 Atlantic Ave Unit 71
- 74 Atlantic Ave
- 72 Atlantic Ave
- 82 Atlantic Ave
- 10 Lincoln Place
- 30 Lincoln Place
- 107 Forest Ave Unit 2R
- 18 Lincoln Place
- 14 Lincoln Place
- 50 Atlantic Ave