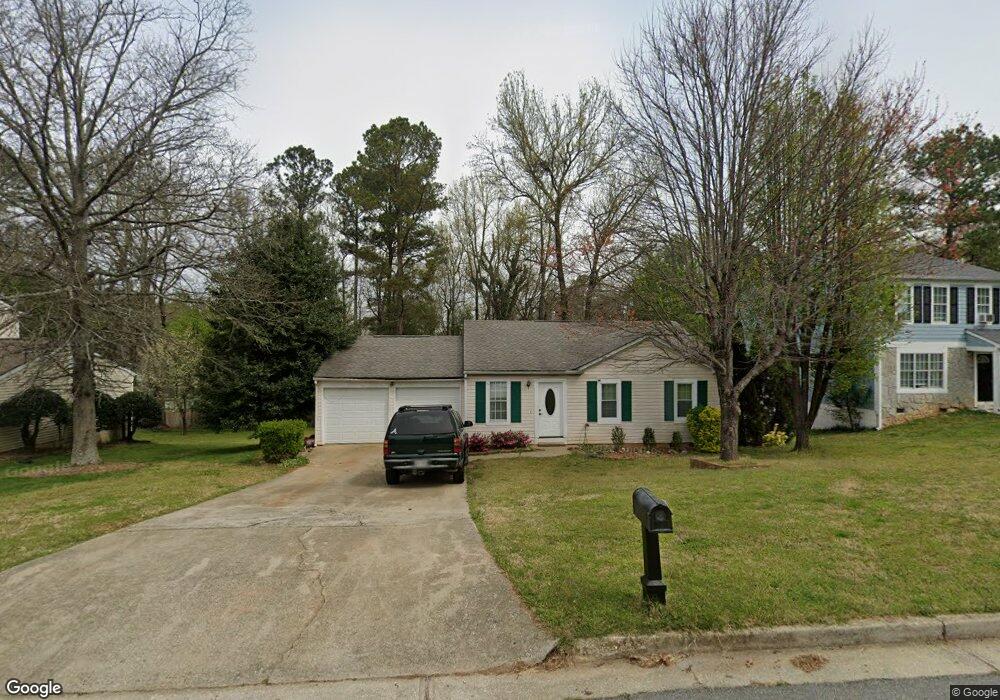
3930 Brooks Bridge Crossing Unit 5 Alpharetta, GA 30022
Estimated Value: $395,467 - $460,000
3
Beds
2
Baths
1,056
Sq Ft
$402/Sq Ft
Est. Value
About This Home
This home is located at 3930 Brooks Bridge Crossing Unit 5, Alpharetta, GA 30022 and is currently estimated at $424,867, approximately $402 per square foot. 3930 Brooks Bridge Crossing Unit 5 is a home located in Fulton County with nearby schools including Dolvin Elementary School, Autrey Mill Middle School, and Johns Creek High School.
Ownership History
Date
Name
Owned For
Owner Type
Purchase Details
Closed on
Oct 7, 2022
Sold by
Chaves Santos
Bought by
Chaves Jose
Current Estimated Value
Home Financials for this Owner
Home Financials are based on the most recent Mortgage that was taken out on this home.
Original Mortgage
$146,781
Outstanding Balance
$134,229
Interest Rate
5.66%
Mortgage Type
New Conventional
Estimated Equity
$290,638
Purchase Details
Closed on
Jun 29, 1998
Sold by
Thunell Craig
Bought by
Chavez Jose and Chavez Santos
Home Financials for this Owner
Home Financials are based on the most recent Mortgage that was taken out on this home.
Original Mortgage
$102,408
Interest Rate
7.02%
Mortgage Type
FHA
Purchase Details
Closed on
Sep 20, 1996
Sold by
Milner Shawn R Kathy
Bought by
Thunell Craig Haunani
Create a Home Valuation Report for This Property
The Home Valuation Report is an in-depth analysis detailing your home's value as well as a comparison with similar homes in the area
Home Values in the Area
Average Home Value in this Area
Purchase History
| Date | Buyer | Sale Price | Title Company |
|---|---|---|---|
| Chaves Jose | $117,440 | -- | |
| Chavez Jose | $104,900 | -- | |
| Thunell Craig Haunani | $87,500 | -- |
Source: Public Records
Mortgage History
| Date | Status | Borrower | Loan Amount |
|---|---|---|---|
| Open | Chaves Jose | $146,781 | |
| Previous Owner | Chavez Jose | $102,408 | |
| Closed | Thunell Craig Haunani | $0 |
Source: Public Records
Tax History Compared to Growth
Tax History
| Year | Tax Paid | Tax Assessment Tax Assessment Total Assessment is a certain percentage of the fair market value that is determined by local assessors to be the total taxable value of land and additions on the property. | Land | Improvement |
|---|---|---|---|---|
| 2025 | $4,482 | $168,000 | $31,760 | $136,240 |
| 2023 | $3,926 | $139,080 | $32,680 | $106,400 |
| 2022 | $3,604 | $117,440 | $25,960 | $91,480 |
| 2021 | $2,944 | $93,440 | $18,400 | $75,040 |
| 2020 | $2,540 | $78,920 | $17,960 | $60,960 |
| 2019 | $306 | $77,520 | $17,640 | $59,880 |
| 2018 | $2,177 | $66,840 | $16,520 | $50,320 |
| 2017 | $1,498 | $44,000 | $14,240 | $29,760 |
| 2016 | $1,476 | $44,000 | $14,240 | $29,760 |
| 2015 | $1,492 | $44,000 | $14,240 | $29,760 |
| 2014 | $1,305 | $37,000 | $9,120 | $27,880 |
Source: Public Records
Map
Nearby Homes
- 10515 Colony Glen Dr Unit 2
- 710 Country Manor Way
- 130 Colony Run
- 10415 Plantation Bridge Dr
- 10530 Tuxford Dr
- 125 Oak Bridge Ct Unit 2
- 120 Thome Dr
- 285 Rolling Mist Ct
- 11070 Pinewalk Forest Cir
- 10325 Oxford Mill Cir Unit 1
- 415 Wood Trace Ct
- 235 Wood Shoals Ct
- 10880 Windham Way
- 9925 Lauren Hall Ct
- 125 Sandridge Ct
- 465 Kirkstall Trail
- 10050 Lauren Hall Ct
- 610 Varina Way
- 105 Kimball Bridge Cove
- 3920 Brooks Bridge Crossing
- 3940 Brooks Bridge Crossing
- 10610 Plantation Bridge Dr
- 620 Fieldwood Ln
- 500 Country Glen Ct
- 3910 Brooks Bridge Crossing
- 10620 Plantation Bridge Dr Unit 10620
- 10620 Plantation Bridge Dr Unit 5
- 10620 Plantation Bridge Dr
- 610 Fieldwood Ln Unit 5
- 3945 Brooks Bridge Crossing
- 10590 Plantation Bridge Dr Unit 5
- 505 Country Glen Ct
- 630 Fieldwood Ln
- 3900 Brooks Bridge Crossing
- 3960 Brooks Bridge Crossing
- 600 Fieldwood Ln
- 10635 Plantation Bridge Dr
- 510 Country Glen Ct
- 10645 Plantation Bridge Dr