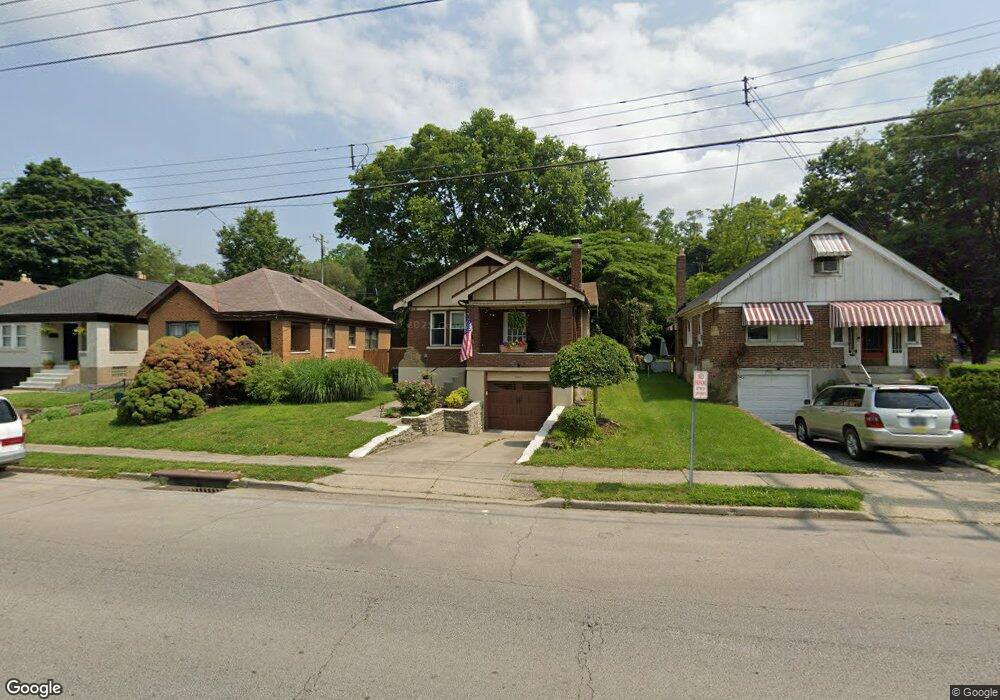
3930 Brotherton Rd Cincinnati, OH 45209
Oakley NeighborhoodEstimated Value: $215,000 - $253,000
1
Bed
1
Bath
878
Sq Ft
$264/Sq Ft
Est. Value
About This Home
This home is located at 3930 Brotherton Rd, Cincinnati, OH 45209 and is currently estimated at $231,960, approximately $264 per square foot. 3930 Brotherton Rd is a home located in Hamilton County with nearby schools including Shroder High School, Clark Montessori High School, and Withrow University High School.
Ownership History
Date
Name
Owned For
Owner Type
Purchase Details
Closed on
Jun 10, 2021
Sold by
Key West Properties Inc
Bought by
Woltermann Adam C
Current Estimated Value
Home Financials for this Owner
Home Financials are based on the most recent Mortgage that was taken out on this home.
Original Mortgage
$147,250
Outstanding Balance
$133,317
Interest Rate
2.9%
Mortgage Type
New Conventional
Estimated Equity
$98,643
Purchase Details
Closed on
Dec 18, 2020
Sold by
Reynolds Loretta and Estate Of Kenis R Reynbod
Bought by
Key West Properties Inc
Home Financials for this Owner
Home Financials are based on the most recent Mortgage that was taken out on this home.
Original Mortgage
$18,000
Interest Rate
2.7%
Mortgage Type
Purchase Money Mortgage
Purchase Details
Closed on
Nov 2, 2005
Sold by
Fath Properties Lp
Bought by
Fath Romaine Court Llc
Purchase Details
Closed on
Mar 23, 1998
Sold by
Weeks Jeffrey R and Weeks Todd L
Bought by
Reynolds Kenis R
Purchase Details
Closed on
Jun 25, 1997
Sold by
Weeks Lester R
Bought by
Weeks Lester R and Weeks Todd L
Create a Home Valuation Report for This Property
The Home Valuation Report is an in-depth analysis detailing your home's value as well as a comparison with similar homes in the area
Home Values in the Area
Average Home Value in this Area
Purchase History
| Date | Buyer | Sale Price | Title Company |
|---|---|---|---|
| Woltermann Adam C | $155,000 | Cincinnatus Title | |
| Woltermann Adam C | -- | None Listed On Document | |
| Key West Properties Inc | $57,500 | None Available | |
| Key West Properties Inc | $57,500 | None Listed On Document | |
| Fath Romaine Court Llc | -- | None Available | |
| Reynolds Kenis R | $40,000 | -- | |
| Weeks Lester R | -- | -- |
Source: Public Records
Mortgage History
| Date | Status | Borrower | Loan Amount |
|---|---|---|---|
| Open | Woltermann Adam C | $147,250 | |
| Closed | Woltermann Adam C | $147,250 | |
| Previous Owner | Key West Properties Inc | $18,000 |
Source: Public Records
Tax History Compared to Growth
Tax History
| Year | Tax Paid | Tax Assessment Tax Assessment Total Assessment is a certain percentage of the fair market value that is determined by local assessors to be the total taxable value of land and additions on the property. | Land | Improvement |
|---|---|---|---|---|
| 2024 | $3,246 | $54,251 | $38,574 | $15,677 |
| 2023 | $3,319 | $54,251 | $38,574 | $15,677 |
| 2022 | $3,809 | $55,878 | $23,135 | $32,743 |
| 2021 | $3,876 | $55,878 | $23,135 | $32,743 |
| 2020 | $3,888 | $55,878 | $23,135 | $32,743 |
| 2019 | $3,560 | $46,564 | $19,278 | $27,286 |
| 2018 | $3,562 | $46,564 | $19,278 | $27,286 |
| 2017 | $3,431 | $46,564 | $19,278 | $27,286 |
| 2016 | $2,891 | $38,262 | $14,651 | $23,611 |
| 2015 | $2,584 | $38,262 | $14,651 | $23,611 |
| 2014 | $2,598 | $38,262 | $14,651 | $23,611 |
| 2013 | $2,425 | $35,102 | $13,440 | $21,662 |
Source: Public Records
Map
Nearby Homes
- 3655 Brotherton Rd
- 3643 Brotherton Rd
- 3636 Brotherton Rd
- 4112 Paxton Woods Dr
- 4929 Charlemar Dr
- 4177 Club View Dr
- 3522 Brotherton Rd
- 3587 Harrow Ave
- 4479 Butterfield Place
- 4480 Butterfield Place
- 4496 Butterfield Place
- 4408 Erie Ave
- 3412 Brotherton Rd
- 3410 Brotherton Rd
- 4335 Conant St
- 5044 W Eastwood Cir
- 3880 Marburg Ave
- 3713 Erie Ave
- 4214 Marburg Ave
- 3684 Ashworth Dr
- 3820 Brotherton Rd
- 3932 Brotherton Rd
- 3818 Brotherton Rd
- 3816 Brotherton Rd
- 3934 Brotherton Rd
- 3814 Brotherton Rd
- 3936 Brotherton Rd
- 3812 Brotherton Rd
- 3810 Brotherton Rd
- 3938 Brotherton Rd
- 3808 Brotherton Rd
- 3813 Brotherton Rd
- 3806 Brotherton Rd
- 3811 Brotherton Rd
- 3811 Brotherton Rd
- 3804 Brotherton Rd
- 3809 Brotherton Rd
- 3802 Brotherton Rd
- 3807 Brotherton Rd
- 3800 Brotherton Rd