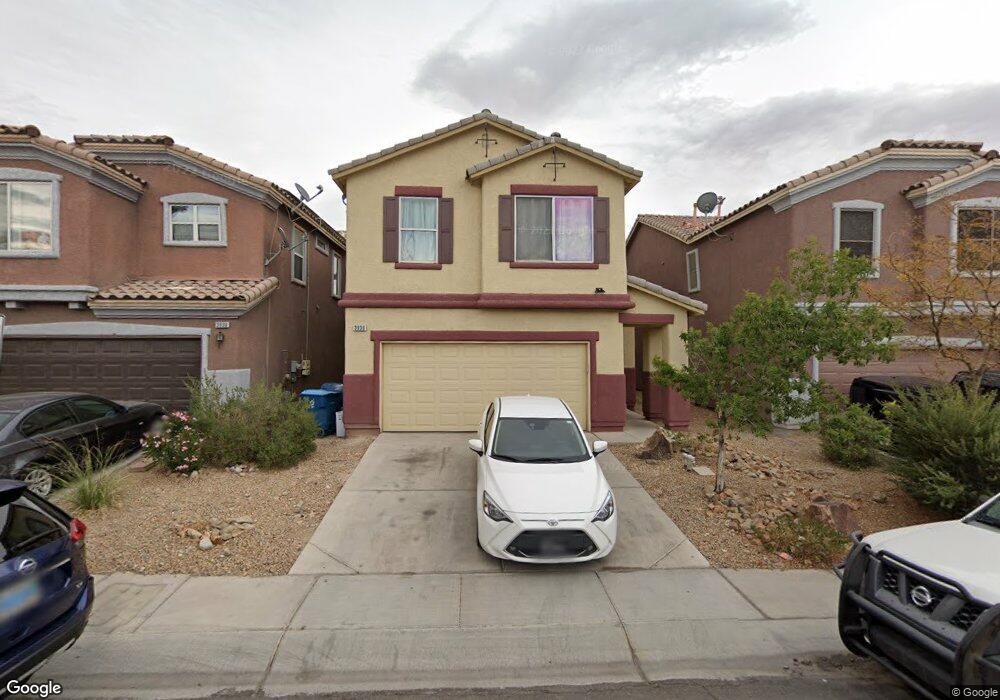
3930 Falling Heart Ct Unit none Las Vegas, NV 89115
Estimated Value: $395,473
3
Beds
3
Baths
1,949
Sq Ft
$203/Sq Ft
Est. Value
About This Home
This home is located at 3930 Falling Heart Ct Unit none, Las Vegas, NV 89115 and is currently priced at $395,473, approximately $202 per square foot. 3930 Falling Heart Ct Unit none is a home located in Clark County with nearby schools including Zel & Mary Lowman Elementary School, J.E. Manch Elementary School, and Carroll M. Johnston STEM Academy of Environmental Studies.
Ownership History
Date
Name
Owned For
Owner Type
Purchase Details
Closed on
Apr 19, 2022
Sold by
Johnson Walter G
Bought by
Babakhanyan Enterprises Llc
Current Estimated Value
Purchase Details
Closed on
Sep 26, 2011
Sold by
The Bank Of New York Mellon
Bought by
Johnson Walter G
Home Financials for this Owner
Home Financials are based on the most recent Mortgage that was taken out on this home.
Original Mortgage
$60,225
Interest Rate
4.15%
Mortgage Type
New Conventional
Purchase Details
Closed on
May 31, 2011
Sold by
Kim Paul
Bought by
The Bank Of New York Mellon and The Bank Of New York
Purchase Details
Closed on
Sep 26, 2005
Sold by
Beazer Homes Holdings Corp
Bought by
Kim Paul
Home Financials for this Owner
Home Financials are based on the most recent Mortgage that was taken out on this home.
Original Mortgage
$194,778
Interest Rate
5.75%
Mortgage Type
Unknown
Create a Home Valuation Report for This Property
The Home Valuation Report is an in-depth analysis detailing your home's value as well as a comparison with similar homes in the area
Home Values in the Area
Average Home Value in this Area
Purchase History
| Date | Buyer | Sale Price | Title Company |
|---|---|---|---|
| Babakhanyan Enterprises Llc | $384,500 | First American Title | |
| Johnson Walter G | $80,300 | First American Title Paseo | |
| The Bank Of New York Mellon | $205,241 | Accommodation | |
| Kim Paul | $243,473 | First Amer Title Co Of Nv |
Source: Public Records
Mortgage History
| Date | Status | Borrower | Loan Amount |
|---|---|---|---|
| Previous Owner | Johnson Walter G | $60,225 | |
| Previous Owner | Kim Paul | $194,778 |
Source: Public Records
Tax History Compared to Growth
Tax History
| Year | Tax Paid | Tax Assessment Tax Assessment Total Assessment is a certain percentage of the fair market value that is determined by local assessors to be the total taxable value of land and additions on the property. | Land | Improvement |
|---|---|---|---|---|
| 2025 | $1,478 | $106,917 | $27,300 | $79,617 |
| 2024 | $1,369 | $106,917 | $27,300 | $79,617 |
| 2023 | $1,369 | $104,070 | $29,050 | $75,020 |
| 2022 | $1,268 | $91,165 | $22,750 | $68,415 |
| 2021 | $1,174 | $85,970 | $21,000 | $64,970 |
| 2020 | $1,088 | $83,558 | $19,250 | $64,308 |
| 2019 | $1,019 | $71,856 | $15,750 | $56,106 |
| 2018 | $973 | $59,848 | $12,250 | $47,598 |
| 2017 | $1,650 | $56,275 | $11,200 | $45,075 |
| 2016 | $912 | $47,021 | $7,000 | $40,021 |
| 2015 | $909 | $41,201 | $4,200 | $37,001 |
| 2014 | $881 | $31,396 | $4,200 | $27,196 |
Source: Public Records
Map
Nearby Homes
- 4271 Lemay St Unit 3
- 4278 Lemay St Unit 2
- 3937 Tatiana St
- 4004 Emerald Wood St
- 4734 Valleyside Ave
- 4121 Story Rock St
- 4774 Valleyside Ave
- 4349 Faberge Ave
- 3907 Lancome St
- 4219 Studio St
- 0 Marion & Gowan Unit 2212764
- 4311 Faberge Ave
- 4783 Corsaire Ave
- 3829 N Nellis Blvd
- 3736 Steinbeck Dr
- 4323 Paramount St
- 4305 Puebla St
- 4329 Studio St
- 3485 Cactus Springs Dr
- 4199 Dobson Dr
- 3930 Falling Heart Ct
- 3936 Falling Heart Ct
- 3924 Falling Heart Ct
- 3942 Falling Heart Ct
- 3948 Falling Heart Ct
- 3927 Chasing Heart Way
- 3939 Chasing Heart Way
- 3945 Chasing Heart Way
- 3954 Falling Heart Ct
- 3951 Chasing Heart Way
- 3929 Falling Heart Ct
- 3935 Falling Heart Ct
- 4617 Chanted Heart Ave
- 3923 Falling Heart Ct Unit none
- 4611 Chanted Heart Ave
- 4623 Chanted Heart Ave
- 3941 Falling Heart Ct
- 4605 Chanted Heart Ave
- 3957 Chasing Heart Way