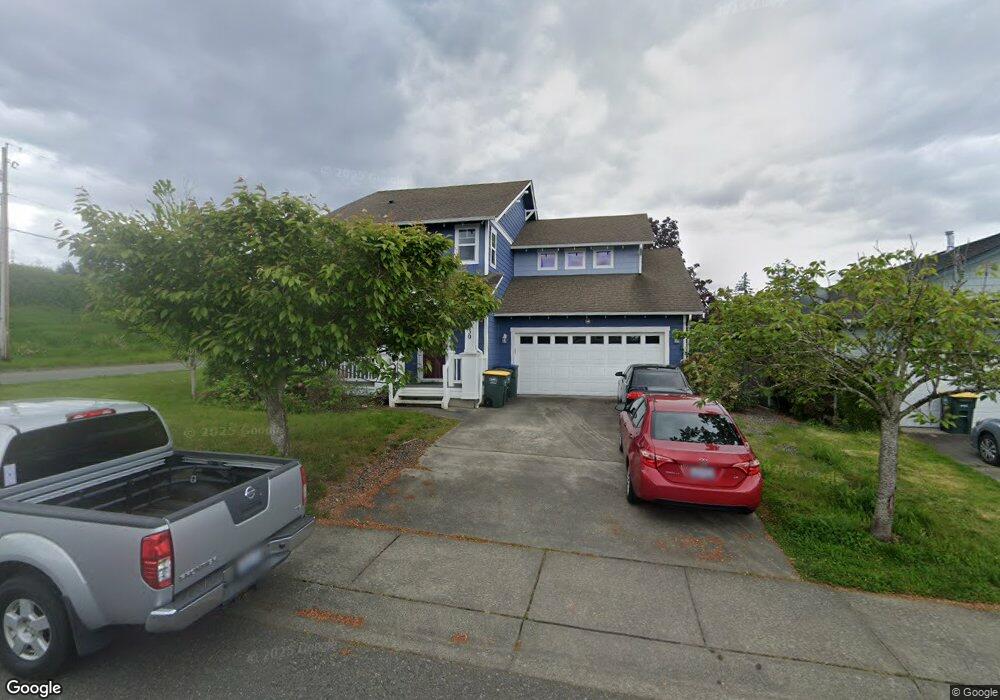
3930 Keystone Way Bellingham, WA 98226
Barkley NeighborhoodEstimated Value: $708,755 - $745,000
4
Beds
3
Baths
2,336
Sq Ft
$311/Sq Ft
Est. Value
About This Home
This home is located at 3930 Keystone Way, Bellingham, WA 98226 and is currently estimated at $726,439, approximately $310 per square foot. 3930 Keystone Way is a home located in Whatcom County with nearby schools including Northern Heights Elementary School, Shuksan Middle School, and Squalicum High School.
Ownership History
Date
Name
Owned For
Owner Type
Purchase Details
Closed on
Jul 20, 2016
Sold by
Donahue John Nathan
Bought by
Donahue John Nathan and Ngo Truc
Current Estimated Value
Home Financials for this Owner
Home Financials are based on the most recent Mortgage that was taken out on this home.
Original Mortgage
$295,450
Outstanding Balance
$236,010
Interest Rate
3.6%
Mortgage Type
VA
Estimated Equity
$490,429
Purchase Details
Closed on
Oct 5, 2009
Sold by
Carpenter Robert L and Carpenter Loretta R
Bought by
Donahue John Nathan
Home Financials for this Owner
Home Financials are based on the most recent Mortgage that was taken out on this home.
Original Mortgage
$339,648
Interest Rate
5.02%
Mortgage Type
VA
Purchase Details
Closed on
Apr 30, 2003
Sold by
Homestead Nw Dev Co
Bought by
Carpenter Robert L and Carpenter Loretta R
Home Financials for this Owner
Home Financials are based on the most recent Mortgage that was taken out on this home.
Original Mortgage
$140,000
Interest Rate
5.02%
Mortgage Type
Purchase Money Mortgage
Create a Home Valuation Report for This Property
The Home Valuation Report is an in-depth analysis detailing your home's value as well as a comparison with similar homes in the area
Home Values in the Area
Average Home Value in this Area
Purchase History
| Date | Buyer | Sale Price | Title Company |
|---|---|---|---|
| Donahue John Nathan | -- | Nextitle | |
| Donahue John Nathan | $332,780 | Stewart Title Company | |
| Carpenter Robert L | $219,142 | Chicago Title Insurance |
Source: Public Records
Mortgage History
| Date | Status | Borrower | Loan Amount |
|---|---|---|---|
| Open | Donahue John Nathan | $295,450 | |
| Closed | Donahue John Nathan | $339,648 | |
| Previous Owner | Carpenter Robert L | $140,000 |
Source: Public Records
Tax History Compared to Growth
Tax History
| Year | Tax Paid | Tax Assessment Tax Assessment Total Assessment is a certain percentage of the fair market value that is determined by local assessors to be the total taxable value of land and additions on the property. | Land | Improvement |
|---|---|---|---|---|
| 2024 | $4,979 | $612,831 | $218,015 | $394,816 |
| 2023 | $4,979 | $639,778 | $227,601 | $412,177 |
| 2022 | $4,308 | $561,209 | $199,650 | $361,559 |
| 2021 | $4,161 | $463,809 | $165,000 | $298,809 |
| 2020 | $4,062 | $422,740 | $109,039 | $313,701 |
| 2019 | $3,879 | $394,933 | $101,955 | $292,978 |
| 2018 | $4,022 | $354,225 | $91,455 | $262,770 |
| 2017 | $3,501 | $313,421 | $80,920 | $232,501 |
| 2016 | $3,235 | $284,794 | $73,640 | $211,154 |
| 2015 | $3,422 | $271,387 | $70,000 | $201,387 |
| 2014 | -- | $279,175 | $68,628 | $210,547 |
| 2013 | -- | $266,973 | $66,500 | $200,473 |
Source: Public Records
Map
Nearby Homes
- 3827 Keystone Way
- 1368 Roma Rd
- 1430 Mt Baker Hwy
- 3817 E Sunset Dr
- 1445 Mt Baker Hwy
- 3715 E Sunset Dr
- 4121 Malachite Dr
- 4136 Malachite Dr
- 3606 Tree Farm Ct
- 1430 Welling Rd
- 4220 Brays Way
- 1314 Welling Rd
- 4269 Dewey Rd
- 1668 Sapphire Trail
- 3871 Cindy Ln
- 1379 Northwood Ct
- 0 E Bakerview Rd Unit NWM2398341
- 3713 Bristol St
- 3709 Bristol St
- 1812 Squalicum Mountain Rd
- 3926 Keystone Way
- 4159 Britton Loop Rd
- 3922 Keystone Way
- 3937 Ruston Way
- 3929 Ruston Way
- 3929 Keystone Way
- 3925 Keystone Way
- 3918 Keystone Way
- 3925 Ruston Way
- 3921 Keystone Way
- 3914 Keystone Way
- 3921 Ruston Way
- 4171 Britton Loop Rd
- 4144 Wayside Ct
- 3936 Ruston Way
- 3917 Ruston Way
- 3910 Keystone Way
- 3913 Keystone Way
- 3928 Ruston Way
- 4148 Wayside Ct