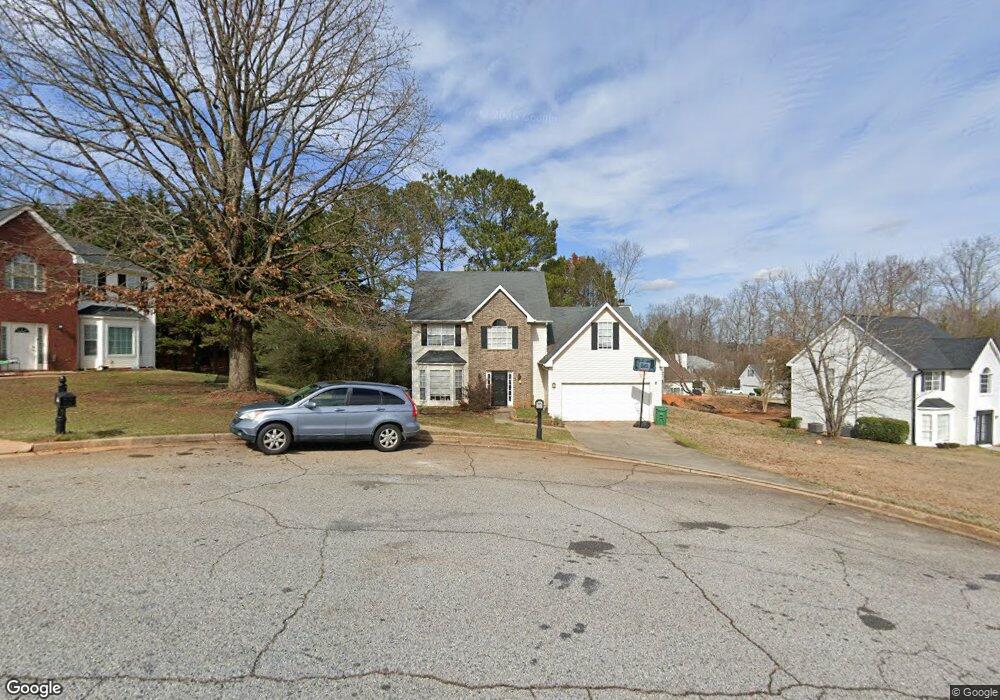
3930 Knights Cross Unit 122 Ellenwood, GA 30294
Southwest DeKalb NeighborhoodEstimated Value: $298,000 - $343,000
4
Beds
3
Baths
2,390
Sq Ft
$133/Sq Ft
Est. Value
About This Home
This home is located at 3930 Knights Cross Unit 122, Ellenwood, GA 30294 and is currently estimated at $319,043, approximately $133 per square foot. 3930 Knights Cross Unit 122 is a home located in DeKalb County with nearby schools including Chapel Hill Elementary School, Salem Middle School, and Martin Luther King- Jr. High School.
Ownership History
Date
Name
Owned For
Owner Type
Purchase Details
Closed on
May 17, 2021
Sold by
Eure Shameen J
Bought by
Korchak Marissa Kelli
Current Estimated Value
Home Financials for this Owner
Home Financials are based on the most recent Mortgage that was taken out on this home.
Original Mortgage
$250,381
Outstanding Balance
$226,553
Interest Rate
3%
Mortgage Type
FHA
Estimated Equity
$92,490
Purchase Details
Closed on
Dec 4, 2017
Sold by
Iwegam Investment Llc
Bought by
Eure Shameen J
Home Financials for this Owner
Home Financials are based on the most recent Mortgage that was taken out on this home.
Original Mortgage
$144,250
Interest Rate
3.94%
Mortgage Type
New Conventional
Purchase Details
Closed on
Sep 13, 2013
Sold by
Federal National Mortgage Association
Bought by
Iwegam Investments Llc
Purchase Details
Closed on
May 7, 2013
Sold by
Green Tree Servicing Llc
Bought by
Federal National Mtg Associati
Purchase Details
Closed on
Jan 21, 2000
Sold by
Mckelvin Marvin
Bought by
Oliver Herber
Home Financials for this Owner
Home Financials are based on the most recent Mortgage that was taken out on this home.
Original Mortgage
$124,338
Interest Rate
8.07%
Mortgage Type
New Conventional
Create a Home Valuation Report for This Property
The Home Valuation Report is an in-depth analysis detailing your home's value as well as a comparison with similar homes in the area
Home Values in the Area
Average Home Value in this Area
Purchase History
| Date | Buyer | Sale Price | Title Company |
|---|---|---|---|
| Korchak Marissa Kelli | $255,000 | -- | |
| Eure Shameen J | $152,000 | -- | |
| Iwegam Investments Llc | $77,000 | -- | |
| Federal National Mtg Associati | $194,898 | -- | |
| Green Tree Servicing Llc | $194,898 | -- | |
| Oliver Herber | $121,900 | -- |
Source: Public Records
Mortgage History
| Date | Status | Borrower | Loan Amount |
|---|---|---|---|
| Open | Korchak Marissa Kelli | $250,381 | |
| Previous Owner | Eure Shameen J | $144,250 | |
| Previous Owner | Oliver Herber | $124,338 |
Source: Public Records
Tax History Compared to Growth
Tax History
| Year | Tax Paid | Tax Assessment Tax Assessment Total Assessment is a certain percentage of the fair market value that is determined by local assessors to be the total taxable value of land and additions on the property. | Land | Improvement |
|---|---|---|---|---|
| 2025 | $5,273 | $109,400 | $13,280 | $96,120 |
| 2024 | $5,683 | $118,800 | $13,280 | $105,520 |
| 2023 | $5,683 | $113,640 | $13,280 | $100,360 |
| 2022 | $4,617 | $96,480 | $13,280 | $83,200 |
| 2021 | $2,239 | $69,720 | $13,280 | $56,440 |
| 2020 | $2,203 | $67,920 | $13,280 | $54,640 |
| 2019 | $2,081 | $63,520 | $13,280 | $50,240 |
| 2018 | $2,024 | $60,800 | $13,200 | $47,600 |
| 2017 | $3,071 | $56,800 | $13,280 | $43,520 |
| 2016 | $2,645 | $51,200 | $13,280 | $37,920 |
| 2014 | $1,777 | $30,788 | $11,028 | $19,760 |
Source: Public Records
Map
Nearby Homes
- 4192 Flakes Mill Manor Ln
- 4200 Flakes Mill Manor Ln
- 4447 Flakes Mill Rd
- 3830 Chimney Stone Ct
- 4287 Traipse Path
- 4060 Day Trail S
- 4055 Chimney Ridge Way
- 4050 Daron Ct
- 4617 River Rd
- 3766 Chimney Ridge Ct
- 3809 Chimney Ridge Ct
- 3924 Chimney Ridge Ct
- 4225 Weelaunee Rd
- 300 Olympian Dr
- 4136 Weelaunee Rd
- 3819 Shane Ct
- 4262 Catalpa Park
- 3930 Knights Cross
- 0 Knights Crossing Unit 7131150
- 3930 Knights Crossing
- 3924 Knights Cross
- 3927 Kings Cove
- 0 Knights Cross Unit 7284712
- 0 Knights Cross Unit 7182200
- 0 Knights Cross Unit 8915622
- 0 Knights Cross
- 3933 Kings Cove
- 3931 Knights Cross
- 3919 Knights Cross
- 3923 Kings Cove
- 3925 Knights Cross
- 3939 Knights Cross
- 0 Kings Cove Unit 7321844
- 4176 Flakes Mill Manor Ln
- 4168 Flakes Mill Manor Ln
- 4184 Flakes Mill Manor Ln
- 4178 Kings Causeway