Estimated Value: $802,000 - $1,024,368
5
Beds
4
Baths
3,100
Sq Ft
$294/Sq Ft
Est. Value
About This Home
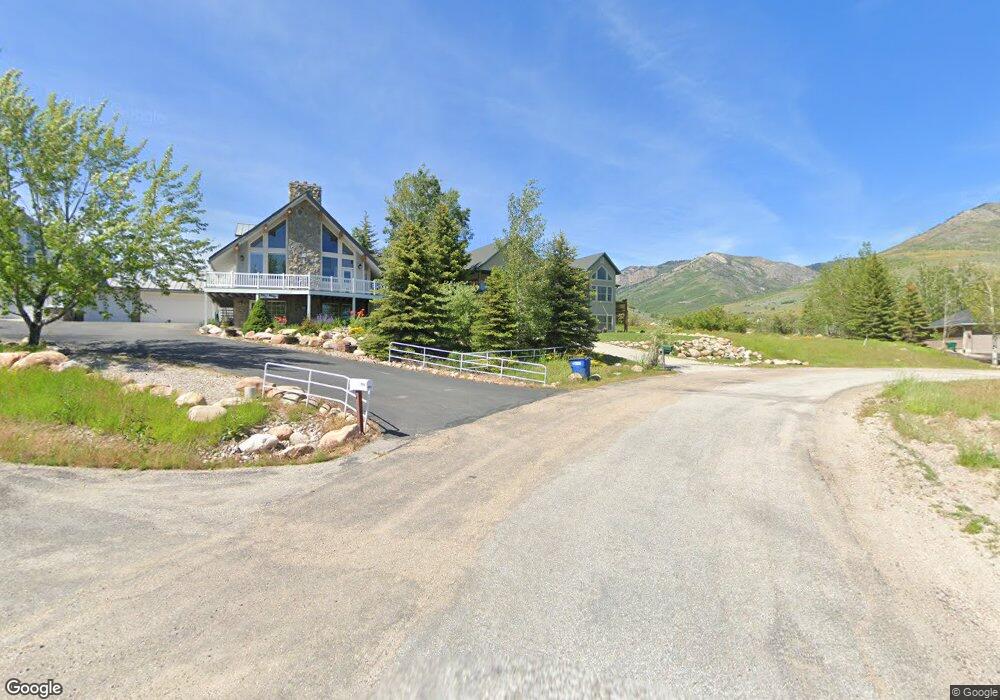
This home is located at 3930 N Mountainoak Dr, Eden, UT 84310 and is currently estimated at $912,092, approximately $294 per square foot. 3930 N Mountainoak Dr is a home located in Weber County with nearby schools including Valley Elementary School, Snowcrest Junior High School, and Weber High School.
Ownership History
Date
Name
Owned For
Owner Type
Purchase Details
Closed on
Sep 6, 2024
Sold by
Garland David C and Garland Susan A
Bought by
Mckeown Hawley Family Trust and Mckeown
Current Estimated Value
Purchase Details
Closed on
Aug 17, 2021
Sold by
Garland David C and Garland Susan A
Bought by
Garland David C and Garland Susan A
Purchase Details
Closed on
May 24, 2019
Sold by
Garland David C and Garland Susan A
Bought by
Garland David C and Garland Susan A
Home Financials for this Owner
Home Financials are based on the most recent Mortgage that was taken out on this home.
Original Mortgage
$259,462
Interest Rate
4.1%
Mortgage Type
FHA
Purchase Details
Closed on
May 14, 2003
Sold by
Powell Dale R and Powell Beverly S
Bought by
Chandler Charles D and Chandler Kathleen
Home Financials for this Owner
Home Financials are based on the most recent Mortgage that was taken out on this home.
Original Mortgage
$191,000
Interest Rate
5.71%
Mortgage Type
Purchase Money Mortgage
Create a Home Valuation Report for This Property
The Home Valuation Report is an in-depth analysis detailing your home's value as well as a comparison with similar homes in the area
Home Values in the Area
Average Home Value in this Area
Purchase History
| Date | Buyer | Sale Price | Title Company |
|---|---|---|---|
| Mckeown Hawley Family Trust | -- | Metro National Title | |
| Garland David C | -- | None Listed On Document | |
| Garland David C | -- | Title Guarantee River Park | |
| Chandler Charles D | -- | First American Title |
Source: Public Records
Mortgage History
| Date | Status | Borrower | Loan Amount |
|---|---|---|---|
| Previous Owner | Garland David C | $259,462 | |
| Previous Owner | Chandler Charles D | $191,000 |
Source: Public Records
Tax History Compared to Growth
Tax History
| Year | Tax Paid | Tax Assessment Tax Assessment Total Assessment is a certain percentage of the fair market value that is determined by local assessors to be the total taxable value of land and additions on the property. | Land | Improvement |
|---|---|---|---|---|
| 2025 | $4,026 | $754,404 | $238,669 | $515,735 |
| 2024 | $3,674 | $386,099 | $125,866 | $260,233 |
| 2023 | $3,490 | $361,900 | $114,958 | $246,942 |
| 2022 | $3,799 | $401,501 | $104,000 | $297,501 |
| 2021 | $2,615 | $465,000 | $124,409 | $340,591 |
| 2020 | $2,297 | $374,653 | $94,432 | $280,221 |
| 2019 | $2,267 | $353,931 | $84,397 | $269,534 |
| 2018 | $2,325 | $348,277 | $79,485 | $268,792 |
| 2017 | $2,199 | $320,843 | $79,485 | $241,358 |
| 2016 | $2,122 | $168,005 | $32,716 | $135,289 |
| 2015 | $977 | $151,104 | $32,716 | $118,388 |
| 2014 | $976 | $148,117 | $32,716 | $115,401 |
Source: Public Records
Map
Nearby Homes
- 3727 N Patio Springs Cir
- 3858 E Eagle Ct
- 4174 N Patio Springs Dr Unit 4
- 4741 E Mountain Trail Ct Unit 11
- 3700 N Foothill Ln
- 3677 N Willowbrook Ln
- 3710 N Foothill Ln
- 3840 N 4975 E Unit A108
- 3669 N Foothill Ln
- 3674 N Willow Brooke Ln
- 3896 N Eagle Ridge Dr E
- 3749 N Eagle Ridge Dr E Unit 64
- 3651 N Eagle Ridge Dr E
- 6822 E Aspen Ln Unit 29
- 4133 N Wolf Ridge Cir Unit 10
- 3615 N Wolf Dr Unit 309
- 3615 N Wolf Lodge Dr Unit 805
- 3615 N Wolf Dr Unit 804
- 3615 N Wolf Lodge Dr Unit 211
- 3615 N Wolf Creek Dr Unit 709
- 3930 N 4650 E
- 3922 N 4650 E
- 3922 N 4650 E Unit 42
- 3922 N Mountainoak Dr
- 3942 N 4650 E
- 3923 N Patiosprings Dr
- 3937 N Patiosprings Dr
- 3937 N Patio Springs Dr
- 3937 N Patiosprings Dr Unit 101
- 3937 N Patiosprings Dr Unit 206
- 3912 N 4650 E
- 3907 N Patiosprings Dr
- 4674 E 3900 N Unit 40
- 4674 E 3900 N
- 3952 N 4650 E
- 3953 N Patiosprings Dr
- 3500 N 4700 E Unit 90
- 3813 N 4700 E
- 3924 N Fairway Oaks Dr
- 4734 E 3925 N