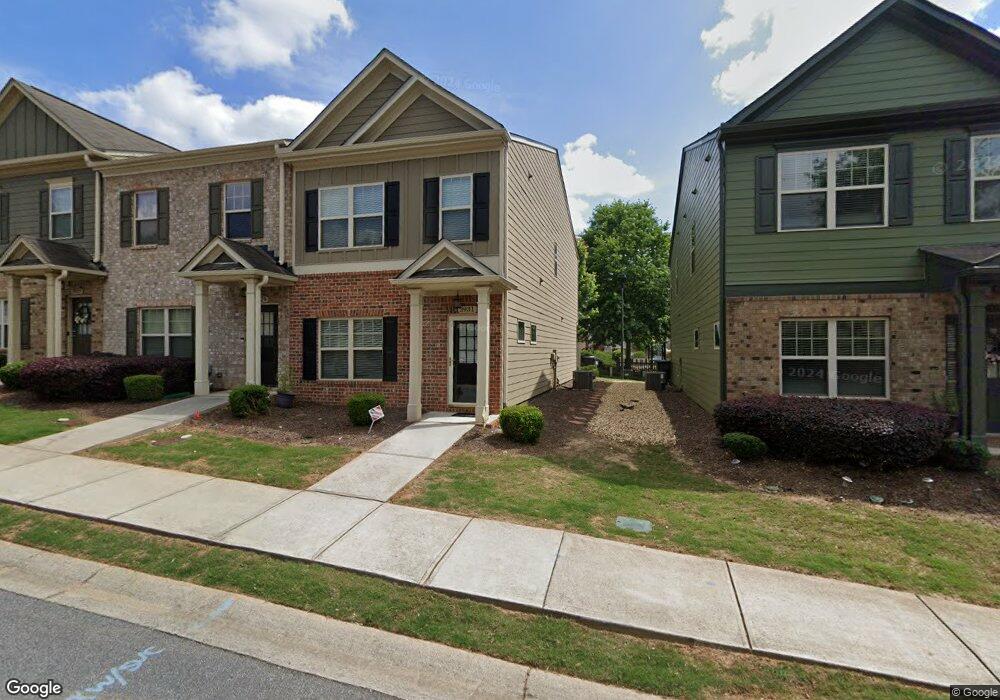
3931 Cyrus Crest Cir NW Unit n/a Kennesaw, GA 30152
Estimated Value: $319,000 - $334,000
2
Beds
3
Baths
1,662
Sq Ft
$195/Sq Ft
Est. Value
About This Home
This home is located at 3931 Cyrus Crest Cir NW Unit n/a, Kennesaw, GA 30152 and is currently estimated at $323,281, approximately $194 per square foot. 3931 Cyrus Crest Cir NW Unit n/a is a home located in Cobb County with nearby schools including Lewis Elementary School, Mcclure Middle School, and Allatoona High School.
Ownership History
Date
Name
Owned For
Owner Type
Purchase Details
Closed on
Nov 21, 2017
Sold by
Mitchell Thomas Bradford E
Bought by
Llamazales Elizabeth M Trustee and Mitchell Nancy Irrev Family Tr
Current Estimated Value
Purchase Details
Closed on
Jan 27, 2015
Sold by
W & H Investments Llc
Bought by
Mitchell Thomas B
Home Financials for this Owner
Home Financials are based on the most recent Mortgage that was taken out on this home.
Original Mortgage
$130,000
Interest Rate
3.94%
Mortgage Type
New Conventional
Purchase Details
Closed on
Jan 7, 2014
Sold by
Reo Funding Solutions Ii L
Bought by
W & H Investments Llc
Home Financials for this Owner
Home Financials are based on the most recent Mortgage that was taken out on this home.
Original Mortgage
$89,960
Interest Rate
4.44%
Mortgage Type
New Conventional
Create a Home Valuation Report for This Property
The Home Valuation Report is an in-depth analysis detailing your home's value as well as a comparison with similar homes in the area
Home Values in the Area
Average Home Value in this Area
Purchase History
| Date | Buyer | Sale Price | Title Company |
|---|---|---|---|
| Llamazales Elizabeth M Trustee | -- | -- | |
| Mitchell Thomas B | $140,000 | -- | |
| W & H Investments Llc | $60,000 | -- |
Source: Public Records
Mortgage History
| Date | Status | Borrower | Loan Amount |
|---|---|---|---|
| Previous Owner | Mitchell Thomas B | $130,000 | |
| Previous Owner | W & H Investments Llc | $89,960 |
Source: Public Records
Tax History Compared to Growth
Tax History
| Year | Tax Paid | Tax Assessment Tax Assessment Total Assessment is a certain percentage of the fair market value that is determined by local assessors to be the total taxable value of land and additions on the property. | Land | Improvement |
|---|---|---|---|---|
| 2025 | $3,866 | $128,308 | $26,000 | $102,308 |
| 2024 | $3,868 | $128,308 | $26,000 | $102,308 |
| 2023 | $3,519 | $116,704 | $16,000 | $100,704 |
| 2022 | $2,947 | $97,092 | $16,000 | $81,092 |
| 2021 | $2,516 | $82,896 | $16,000 | $66,896 |
| 2020 | $3,067 | $77,420 | $16,000 | $61,420 |
| 2019 | $2,244 | $73,932 | $16,000 | $57,932 |
| 2018 | $2,002 | $65,980 | $14,800 | $51,180 |
| 2017 | $1,351 | $55,992 | $8,592 | $47,400 |
| 2016 | $1,352 | $55,992 | $8,592 | $47,400 |
| 2015 | $1,642 | $55,728 | $9,200 | $46,528 |
| 2014 | $143 | $4,800 | $0 | $0 |
Source: Public Records
Map
Nearby Homes
- 3950 Cyrus Crest Cir NW
- 3203 Cyrus Point Ln NW
- 3909 Cyrus Crest Cir NW
- 3102 Marbella Cir Unit 5
- 3126 Marbella Cir Unit 13
- 3112 Marbella Cir Unit 6
- 3128 Marbella Cir Unit 14
- 3114 Marbella Cir Unit 7
- 3132 Marbella Cir Unit 16
- 3116 Marbella Cir Unit 8
- 3140 Marbella Cir Unit 20
- 209 Park Forest Way NW
- 208 Park Forest Way NW
- 436 Two Iron Trail NW
- 3971 Loring Way NW
- 3112 Calumet Cir NW
- 1182 Cool Springs Dr NW
- 4294 Grand Oaks Dr NW Unit 2
- 202 Five Iron Ct NW
- 206 Five Iron Ct NW
- 3931 Cyrus Crest Cir NW
- 3929 Cyrus Crest Cir NW
- 3935 Cyrus Crest Cir NW
- 3927 Cyrus Crest Cir NW
- 3927 Cyrus Crest Cir NW Unit n/a
- 3937 Cyrus Crest Cir NW
- 3925 Cyrus Crest Cir NW
- 3939 Cyrus Crest Cir NW
- 3921 Cyrus Crest Cir NW Unit 3921
- 3921 Cyrus Crest Cir NW Unit 85
- 3921 Cyrus Crest Cir NW
- 3941 Cyrus Crest Cir NW
- 3921 Cyrus Creek Cir Unit 85
- 3211 Cyrus Point Ln NW Unit Kennesaw
- 3211 Cyrus Point Ln NW
- 3211 Cyrus Point Ln NW Unit 3211
- 3919 Cyrus Crest Cir NW Unit 86
- 3919 Cyrus Crest Cir NW
- 0 Cyrus Crest Cir NW Unit 7039744
- 0 Cyrus Crest Cir NW Unit 7026389