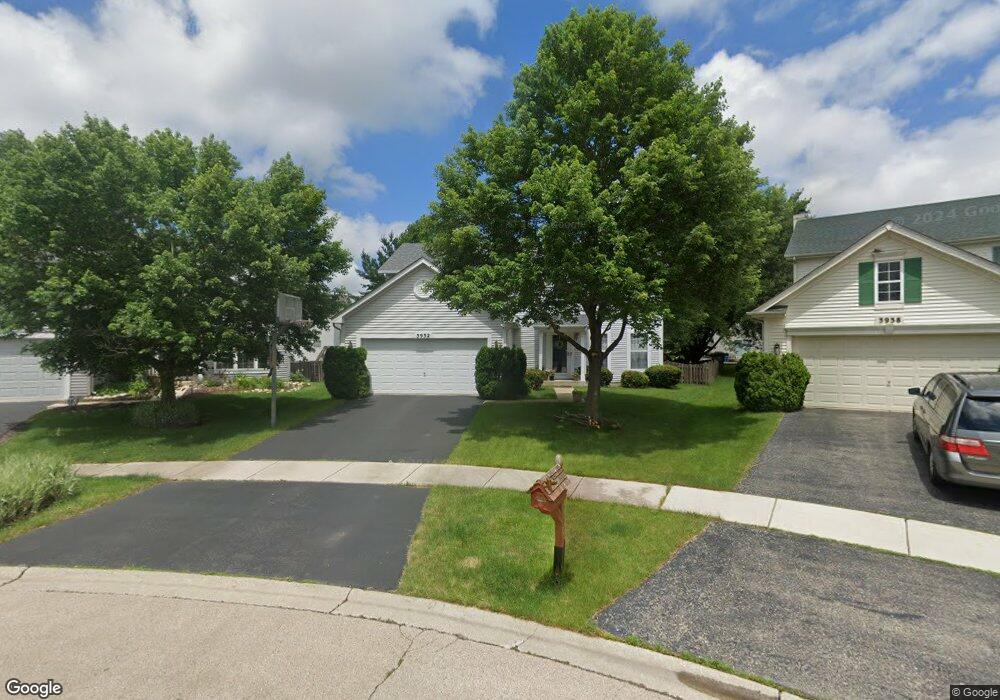
3932 Nicholas Ct Aurora, IL 60504
Far East NeighborhoodEstimated Value: $414,000 - $534,000
4
Beds
3
Baths
2,430
Sq Ft
$206/Sq Ft
Est. Value
About This Home
This home is located at 3932 Nicholas Ct, Aurora, IL 60504 and is currently estimated at $500,380, approximately $205 per square foot. 3932 Nicholas Ct is a home located in DuPage County with nearby schools including Gombert Elementary School, Still Middle School, and Waubonsie Valley High School.
Ownership History
Date
Name
Owned For
Owner Type
Purchase Details
Closed on
Mar 18, 2020
Sold by
Marupudi Sribalam and Marupudi Mamatha
Bought by
Marupudi Sribalam and Marupudi Mamatha
Current Estimated Value
Purchase Details
Closed on
Mar 30, 2004
Sold by
Paul Bryan A and Paul Astrid
Bought by
Marupudi Sribalaji and Marupudi Mamatha
Home Financials for this Owner
Home Financials are based on the most recent Mortgage that was taken out on this home.
Original Mortgage
$228,800
Interest Rate
4.5%
Mortgage Type
Purchase Money Mortgage
Purchase Details
Closed on
Mar 29, 2000
Sold by
Thatchers Grove Llc
Bought by
Paul Bryan A and Paul Astrid
Home Financials for this Owner
Home Financials are based on the most recent Mortgage that was taken out on this home.
Original Mortgage
$202,600
Interest Rate
7.87%
Create a Home Valuation Report for This Property
The Home Valuation Report is an in-depth analysis detailing your home's value as well as a comparison with similar homes in the area
Home Values in the Area
Average Home Value in this Area
Purchase History
| Date | Buyer | Sale Price | Title Company |
|---|---|---|---|
| Marupudi Sribalam | -- | Attorney | |
| Marupudi Sribalaji | $286,000 | Ctic | |
| Paul Bryan A | $213,500 | -- |
Source: Public Records
Mortgage History
| Date | Status | Borrower | Loan Amount |
|---|---|---|---|
| Previous Owner | Marupudi Sribalaji | $228,800 | |
| Previous Owner | Paul Bryan A | $202,600 |
Source: Public Records
Tax History
| Year | Tax Paid | Tax Assessment Tax Assessment Total Assessment is a certain percentage of the fair market value that is determined by local assessors to be the total taxable value of land and additions on the property. | Land | Improvement |
|---|---|---|---|---|
| 2024 | $10,819 | $150,286 | $37,060 | $113,226 |
| 2023 | $10,324 | $135,040 | $33,300 | $101,740 |
| 2022 | $10,251 | $128,240 | $31,380 | $96,860 |
| 2021 | $9,981 | $123,660 | $30,260 | $93,400 |
| 2020 | $10,103 | $123,660 | $30,260 | $93,400 |
| 2019 | $9,750 | $117,610 | $28,780 | $88,830 |
| 2018 | $9,521 | $113,800 | $27,630 | $86,170 |
| 2017 | $9,365 | $109,940 | $26,690 | $83,250 |
| 2016 | $9,200 | $105,500 | $25,610 | $79,890 |
| 2015 | $9,109 | $100,170 | $24,320 | $75,850 |
| 2014 | $8,611 | $92,430 | $22,270 | $70,160 |
| 2013 | $8,522 | $93,070 | $22,420 | $70,650 |
Source: Public Records
Map
Nearby Homes
- 3873 Blackstone Dr
- 4152 Calder Ln
- 4172 Calder Ln
- 4139 Winslow Ct
- 4110 Chelsea Manor Cir
- 4158 Irving Rd
- 4184 Calder Ln
- 4122 Chelsea Manor Cir
- 4203 Calder Ln
- 4177 Irving Rd
- 579 Watercress Dr
- 4213 Calder Ln
- 573 Watercress Dr
- 857 Finley Dr
- 4196 Irving Rd
- 3723 Edgebrook Ct
- 4167 Chelsea Manor Cir
- 4204 Chelsea Manor Cir
- 534 Watercress Dr
- 4474 Chelsea Manor Cir
- 3938 Nicholas Ct
- 3926 Nicholas Ct
- 3925 Heinz Dr
- 3935 Heinz Dr
- 3945 Heinz Dr
- 3920 Nicholas Ct
- 3915 Heinz Dr
- 3955 Heinz Dr
- 3944 Nicholas Ct
- 3965 Heinz Dr
- 3905 Heinz Dr
- 3921 Nicholas Ct
- 822 Teasel Ln
- 3956 Nicholas Ct
- 3975 Heinz Dr
- 3927 Nicholas Ct
- 828 Teasel Ln
- 3933 Nicholas Ct
- 840 Teasel Ln
- 3939 Nicholas Ct
Your Personal Tour Guide
Ask me questions while you tour the home.