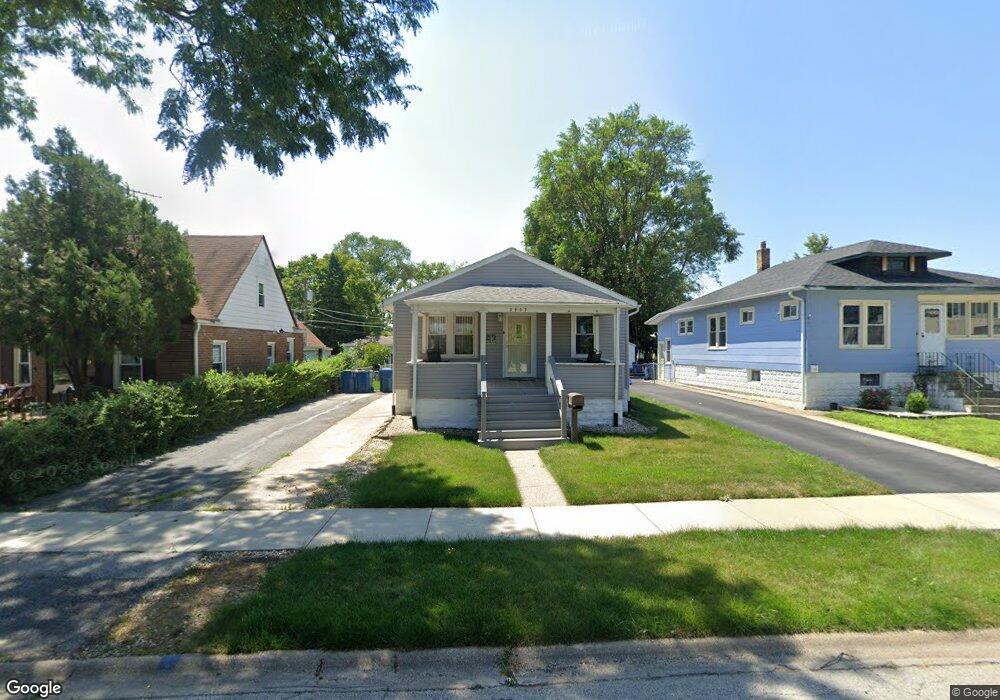
3933 147th Place Midlothian, IL 60445
Estimated Value: $155,000 - $171,000
2
Beds
1
Bath
768
Sq Ft
$214/Sq Ft
Est. Value
About This Home
This home is located at 3933 147th Place, Midlothian, IL 60445 and is currently estimated at $164,479, approximately $214 per square foot. 3933 147th Place is a home located in Cook County with nearby schools including Springfield Elementary School, Bremen High School, and St. Christopher School.
Ownership History
Date
Name
Owned For
Owner Type
Purchase Details
Closed on
Aug 22, 2001
Sold by
Danaher Gail A and Isenberg John A
Bought by
Tuttle Laura M
Current Estimated Value
Home Financials for this Owner
Home Financials are based on the most recent Mortgage that was taken out on this home.
Original Mortgage
$87,624
Outstanding Balance
$34,082
Interest Rate
7.11%
Mortgage Type
FHA
Estimated Equity
$130,397
Purchase Details
Closed on
Nov 4, 1996
Sold by
Powers Richard J
Bought by
Danaher Gail A and Isenberg John A
Home Financials for this Owner
Home Financials are based on the most recent Mortgage that was taken out on this home.
Original Mortgage
$82,873
Interest Rate
8.18%
Mortgage Type
FHA
Purchase Details
Closed on
Jan 19, 1994
Sold by
Powers Dawn A
Bought by
Powers Richard J
Create a Home Valuation Report for This Property
The Home Valuation Report is an in-depth analysis detailing your home's value as well as a comparison with similar homes in the area
Home Values in the Area
Average Home Value in this Area
Purchase History
| Date | Buyer | Sale Price | Title Company |
|---|---|---|---|
| Tuttle Laura M | $89,000 | -- | |
| Danaher Gail A | $83,000 | Attorneys Natl Title Network | |
| Powers Richard J | -- | -- | |
| Powers Richard J | -- | -- |
Source: Public Records
Mortgage History
| Date | Status | Borrower | Loan Amount |
|---|---|---|---|
| Open | Tuttle Laura M | $87,624 | |
| Previous Owner | Danaher Gail A | $82,873 |
Source: Public Records
Tax History Compared to Growth
Tax History
| Year | Tax Paid | Tax Assessment Tax Assessment Total Assessment is a certain percentage of the fair market value that is determined by local assessors to be the total taxable value of land and additions on the property. | Land | Improvement |
|---|---|---|---|---|
| 2024 | $2,908 | $10,473 | $2,079 | $8,394 |
| 2023 | $2,835 | $11,000 | $2,079 | $8,921 |
| 2022 | $2,835 | $9,454 | $1,782 | $7,672 |
| 2021 | $2,766 | $9,454 | $1,782 | $7,672 |
| 2020 | $2,732 | $9,454 | $1,782 | $7,672 |
| 2019 | $1,441 | $6,748 | $1,633 | $5,115 |
| 2018 | $1,416 | $6,748 | $1,633 | $5,115 |
| 2017 | $1,389 | $6,748 | $1,633 | $5,115 |
| 2016 | $1,853 | $6,815 | $1,485 | $5,330 |
| 2015 | $1,758 | $6,815 | $1,485 | $5,330 |
| 2014 | $1,729 | $6,815 | $1,485 | $5,330 |
| 2013 | $1,660 | $7,168 | $1,485 | $5,683 |
Source: Public Records
Map
Nearby Homes
- 4031 147th St
- 14613 Keystone Ave
- 14837 Karlov Ave
- 14618 Keystone Ave
- 14903 Terrace Ln
- 3846 149th St
- 14539 Crawford Ave
- 14914 Avers Ave
- 14944 Springfield Ave
- 14970 Pulaski Rd Unit 5
- 14969 Willow Crest Unit 17
- 14501 Keystone Ave Unit 8
- 14949 Avers Ave
- 15035 Harding Ave
- 14301 Hamlin Ave
- 14839 Lawndale Ave
- 3631 147th St
- 3625 147th St
- 15031 Hamlin Ave
- 3618 148th St
- 3929 147th Place
- 3939 147th Place
- 3923 147th Place
- 3932 148th St
- 3938 148th St
- 3921 147th Place
- 14770 Waverly Ave
- 3942 148th St
- 3934 147th Place
- 3930 147th Place
- 14731 Pulaski Rd
- 14735 Pulaski Rd
- 14729 Pulaski Rd
- 14727 Pulaski Rd
- 14727 Pulaski Rd
- 3926 147th Place
- 3942 147th Place
- 3942 147th Place Unit HOME
- 3917 147th Place
- 3922 147th Place