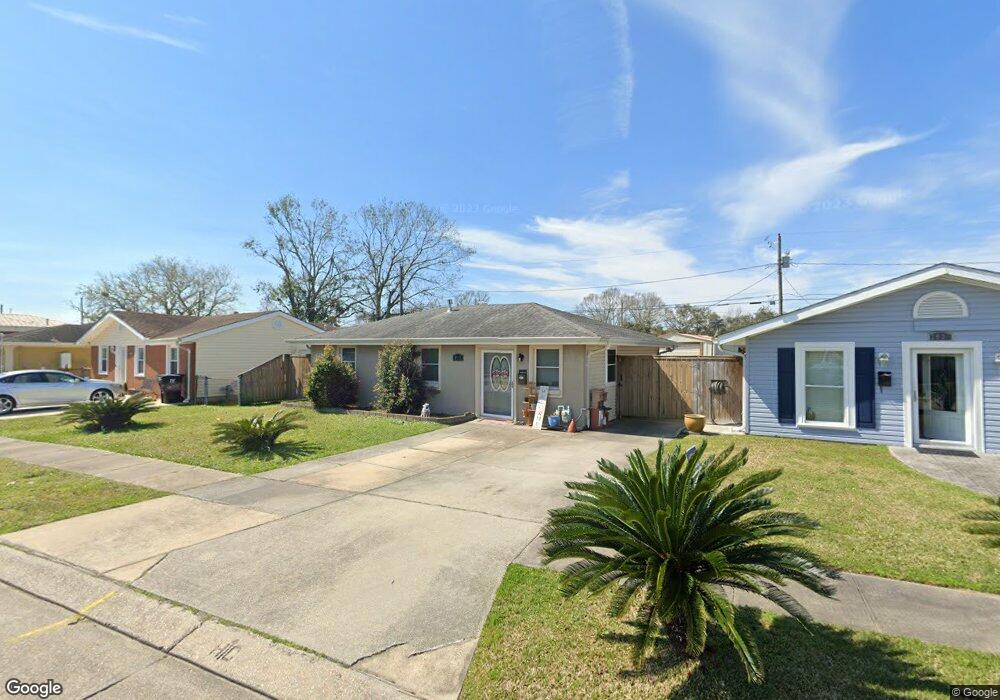
3933 Alabama Ave Kenner, LA 70065
Estimated Value: $157,000 - $197,000
2
Beds
1
Bath
900
Sq Ft
$198/Sq Ft
Est. Value
About This Home
This home is located at 3933 Alabama Ave, Kenner, LA 70065 and is currently estimated at $178,414, approximately $198 per square foot. 3933 Alabama Ave is a home located in Jefferson Parish with nearby schools including Freetown Elementary School, Greenlawn Terrace Elementary School, and Airline Park Academy For Advanced Studies.
Ownership History
Date
Name
Owned For
Owner Type
Purchase Details
Closed on
Dec 29, 2022
Sold by
Decedue Rick Matthew
Bought by
Ricks Andrew P and Ricks Darrell J
Current Estimated Value
Home Financials for this Owner
Home Financials are based on the most recent Mortgage that was taken out on this home.
Original Mortgage
$142,400
Outstanding Balance
$138,004
Interest Rate
6.61%
Mortgage Type
New Conventional
Estimated Equity
$40,410
Purchase Details
Closed on
Nov 2, 2015
Sold by
Herbert Allen J
Bought by
Decedue Rick Matthew
Home Financials for this Owner
Home Financials are based on the most recent Mortgage that was taken out on this home.
Original Mortgage
$120,000
Interest Rate
3.94%
Mortgage Type
New Conventional
Purchase Details
Closed on
Jun 30, 2005
Sold by
Santos Juan
Bought by
Herbert Allen
Create a Home Valuation Report for This Property
The Home Valuation Report is an in-depth analysis detailing your home's value as well as a comparison with similar homes in the area
Home Values in the Area
Average Home Value in this Area
Purchase History
| Date | Buyer | Sale Price | Title Company |
|---|---|---|---|
| Ricks Andrew P | $178,000 | Crescent Title | |
| Decedue Rick Matthew | $120,000 | None Available | |
| Herbert Allen | $105,000 | -- |
Source: Public Records
Mortgage History
| Date | Status | Borrower | Loan Amount |
|---|---|---|---|
| Open | Ricks Andrew P | $142,400 | |
| Previous Owner | Decedue Rick Matthew | $120,000 |
Source: Public Records
Tax History Compared to Growth
Tax History
| Year | Tax Paid | Tax Assessment Tax Assessment Total Assessment is a certain percentage of the fair market value that is determined by local assessors to be the total taxable value of land and additions on the property. | Land | Improvement |
|---|---|---|---|---|
| 2024 | $2,252 | $17,000 | $3,150 | $13,850 |
| 2023 | $1,687 | $17,000 | $3,150 | $13,850 |
| 2022 | $1,169 | $12,000 | $3,150 | $8,850 |
| 2021 | $1,078 | $12,000 | $3,150 | $8,850 |
| 2020 | $1,068 | $12,000 | $3,150 | $8,850 |
| 2019 | $1,090 | $12,000 | $3,150 | $8,850 |
| 2018 | $295 | $12,000 | $3,150 | $8,850 |
| 2017 | $993 | $12,000 | $3,150 | $8,850 |
| 2016 | $993 | $12,000 | $3,150 | $8,850 |
| 2015 | $196 | $10,460 | $3,150 | $7,310 |
| 2014 | $196 | $10,460 | $3,150 | $7,310 |
Source: Public Records
Map
Nearby Homes
- 3911 California Ave
- 4012 Colorado Ave
- 1725 Newport Place Unit 4
- 3911 Connecticut Ave
- 3916 Connecticut Ave
- 4209 Arizona Ave
- 3933 Delaware Ave
- 3925 Delaware Ave
- 4101 Delaware Ave Unit 14
- 4101 Delaware Ave Unit 6
- 14 Rue Dijon None
- 14 Rue Dijon
- 4237 California Ave
- 3809 Delaware Ave
- 72 Chateau Magdelaine Dr
- 3620 Arizona Ave
- LOTS 38 & 39 Florida Ave
- 3623 California Ave
- 3620 Arkansas Ave
- 3 Monte Carlo Dr
- 3937 Alabama Ave
- 3929 Alabama Ave
- 3925 Alabama Ave
- 3941 Alabama Ave
- 3932 Alabama Ave
- 3936 Alabama Ave
- 3945 Alabama Ave
- 3928 Alabama Ave
- 3921 Alabama Ave
- 3940 Alabama Ave
- 3924 Alabama Ave
- 3944 Alabama Ave
- 3920 Alabama Ave
- 3917 Alabama Ave
- 4001 Alabama Ave
- 3916 Alabama Ave
- 3913 Alabama Ave
- 3933 Arizona Ave
- 3937 Arizona Ave
- 4000 Alabama Ave