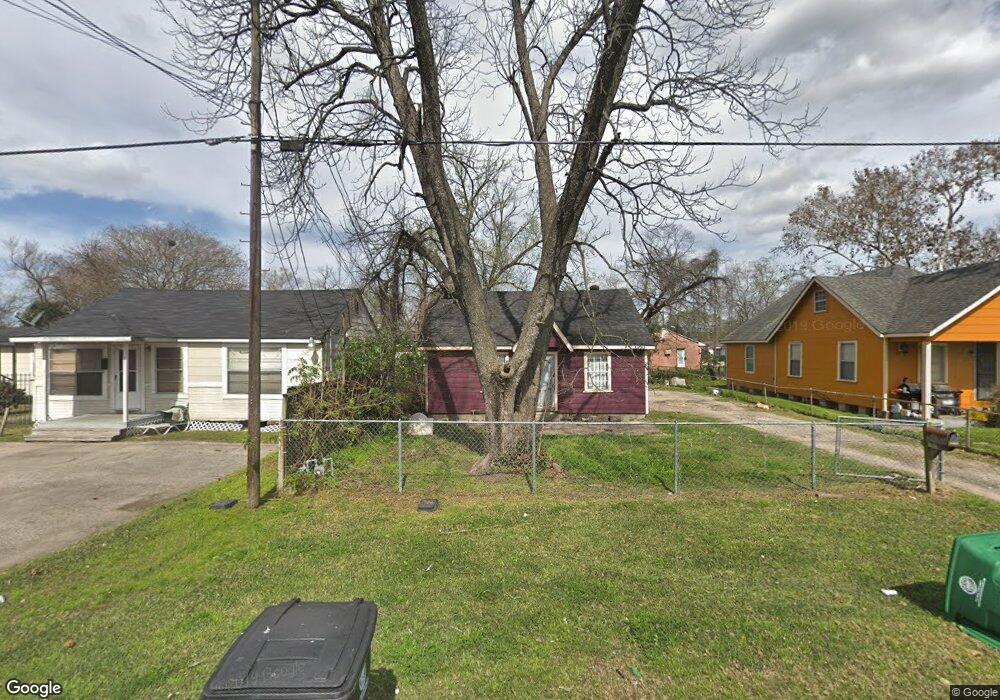
3933 Caplin St Houston, TX 77026
Trinity-Houston Gardens NeighborhoodEstimated Value: $133,677 - $220,000
2
Beds
1
Bath
1,092
Sq Ft
$170/Sq Ft
Est. Value
About This Home
This home is located at 3933 Caplin St, Houston, TX 77026 and is currently estimated at $185,919, approximately $170 per square foot. 3933 Caplin St is a home located in Harris County with nearby schools including Kashmere Gardens Elementary School, Key Middle, and Kashmere High School.
Ownership History
Date
Name
Owned For
Owner Type
Purchase Details
Closed on
Oct 12, 2011
Sold by
Deshotel Kevin P
Bought by
Deshotel Debra Tracy
Current Estimated Value
Purchase Details
Closed on
Oct 14, 2006
Sold by
Sallee Raymond A
Bought by
Deshotel Kevin
Purchase Details
Closed on
Aug 8, 2000
Sold by
Sallee Raymon
Bought by
Rodriguez Juana Laura
Purchase Details
Closed on
Mar 1, 2000
Sold by
Harris Steve Wayne and Harris Yolanda
Bought by
Sallee Raymon
Purchase Details
Closed on
Aug 22, 1997
Sold by
Robinson Ruby Mae
Bought by
Harris Steve Wayne and Harris Yolanda Price
Home Financials for this Owner
Home Financials are based on the most recent Mortgage that was taken out on this home.
Original Mortgage
$23,500
Interest Rate
7.34%
Mortgage Type
Seller Take Back
Create a Home Valuation Report for This Property
The Home Valuation Report is an in-depth analysis detailing your home's value as well as a comparison with similar homes in the area
Home Values in the Area
Average Home Value in this Area
Purchase History
| Date | Buyer | Sale Price | Title Company |
|---|---|---|---|
| Deshotel Debra Tracy | -- | None Available | |
| Deshotel Kevin | -- | None Available | |
| Rodriguez Juana Laura | -- | -- | |
| Sallee Raymon | -- | First Southwestern Title Co | |
| Harris Steve Wayne | -- | -- |
Source: Public Records
Mortgage History
| Date | Status | Borrower | Loan Amount |
|---|---|---|---|
| Previous Owner | Harris Steve Wayne | $23,500 |
Source: Public Records
Tax History Compared to Growth
Tax History
| Year | Tax Paid | Tax Assessment Tax Assessment Total Assessment is a certain percentage of the fair market value that is determined by local assessors to be the total taxable value of land and additions on the property. | Land | Improvement |
|---|---|---|---|---|
| 2025 | $1,971 | $103,386 | $47,319 | $56,067 |
| 2024 | $1,971 | $94,200 | $38,844 | $55,356 |
| 2023 | $1,971 | $88,400 | $31,781 | $56,619 |
| 2022 | $1,607 | $73,001 | $21,188 | $51,813 |
| 2021 | $1,425 | $61,140 | $21,188 | $39,952 |
| 2020 | $1,246 | $51,458 | $14,125 | $37,333 |
| 2019 | $1,074 | $42,454 | $11,653 | $30,801 |
| 2018 | $946 | $37,403 | $11,653 | $25,750 |
| 2017 | $946 | $37,403 | $11,653 | $25,750 |
| 2016 | $946 | $37,403 | $10,594 | $26,809 |
| 2015 | $1,028 | $39,972 | $12,250 | $27,722 |
| 2014 | $1,028 | $39,972 | $12,250 | $27,722 |
Source: Public Records
Map
Nearby Homes
- 3929 Caplin St
- 3923 Caplin St
- 4034 Caplin St
- 3938 King St
- 4026 Reid St
- 3933 Linder St
- 3818 Lynnfield St
- 3810 Lynnfield St
- 3504 Caplin St Unit C
- 3504 Caplin St Unit D
- 3920B Lynnfield St
- 3924 Lynnfield St
- 3916 Lynnfield St
- 3920 Lynnfield St
- 3908 Lynnfield St
- 3912 Lynnfield St
- 2708 Lynnfield St
- 3429 King St
- 3425 King St
- 3941 Lynnfield St
- 3937 Caplin St
- 3926 Caplin St
- 4001 Caplin St
- 3934 Caplin St
- 3930 Caplin St
- 3938 Caplin St
- 3917 Caplin St
- 4005 Caplin St
- 3918 Melbourne St
- 4002 Caplin St
- 3915 Caplin St
- 4002 Melbourne St
- 3918 Caplin St
- 3914 Melbourne St
- 4006 Caplin St
- 4004 Melbourne St
- 3914 Caplin St
- 3933 Reid St
- 4013 Caplin St
- 3925 Reid St