Estimated Value: $236,000 - $307,000
3
Beds
2
Baths
1,551
Sq Ft
$174/Sq Ft
Est. Value
About This Home
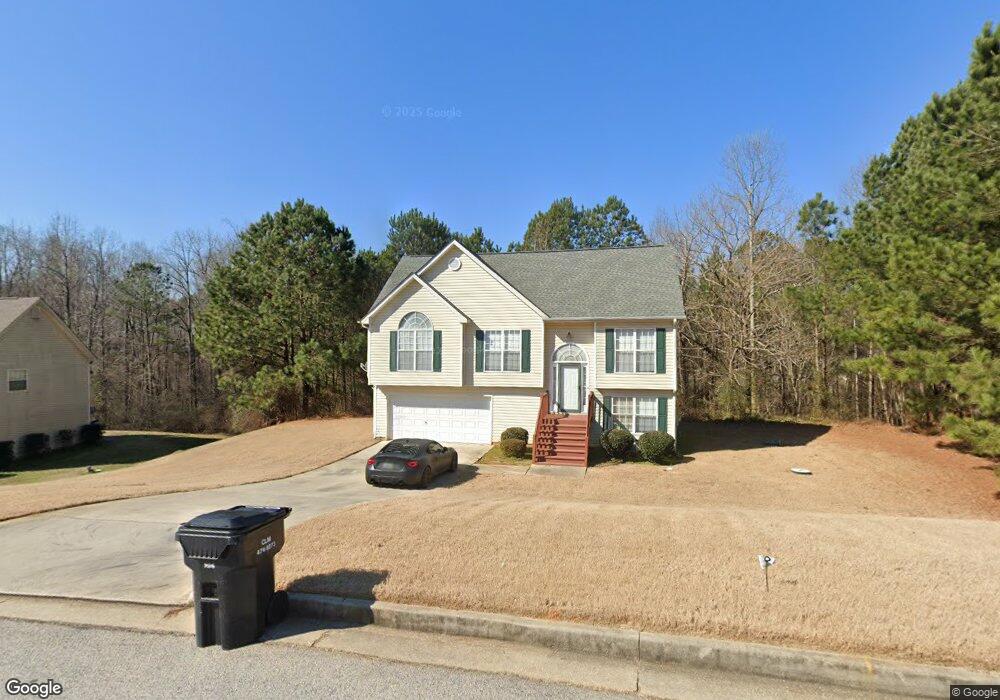
This home is located at 3934 Fieldway Rd, Rex, GA 30273 and is currently estimated at $269,816, approximately $173 per square foot. 3934 Fieldway Rd is a home located in Clayton County with nearby schools including East Clayton Elementary School, Adamson Middle School, and Morrow High School.
Ownership History
Date
Name
Owned For
Owner Type
Purchase Details
Closed on
Jul 25, 2008
Sold by
Us Bank Na 2007-Ahl1
Bought by
Tysinger Valencia D
Current Estimated Value
Home Financials for this Owner
Home Financials are based on the most recent Mortgage that was taken out on this home.
Original Mortgage
$100,992
Outstanding Balance
$65,053
Interest Rate
6.21%
Mortgage Type
FHA
Estimated Equity
$204,763
Purchase Details
Closed on
Feb 5, 2008
Sold by
Whiteside Linda M
Bought by
Us Bank Na
Purchase Details
Closed on
Aug 14, 2006
Sold by
Pullom Ora
Bought by
Whiteside Linda M
Home Financials for this Owner
Home Financials are based on the most recent Mortgage that was taken out on this home.
Original Mortgage
$146,000
Interest Rate
6.71%
Mortgage Type
New Conventional
Purchase Details
Closed on
Oct 29, 2002
Sold by
M & M Custom Homes Inc
Bought by
Pullom Ora
Home Financials for this Owner
Home Financials are based on the most recent Mortgage that was taken out on this home.
Original Mortgage
$127,135
Interest Rate
6.16%
Mortgage Type
FHA
Create a Home Valuation Report for This Property
The Home Valuation Report is an in-depth analysis detailing your home's value as well as a comparison with similar homes in the area
Purchase History
| Date | Buyer | Sale Price | Title Company |
|---|---|---|---|
| Tysinger Valencia D | $9,500 | -- | |
| Us Bank Na | $117,600 | -- | |
| Whiteside Linda M | $146,000 | -- | |
| Pullom Ora | $129,800 | -- |
Source: Public Records
Mortgage History
| Date | Status | Borrower | Loan Amount |
|---|---|---|---|
| Open | Tysinger Valencia D | $100,992 | |
| Previous Owner | Whiteside Linda M | $146,000 | |
| Previous Owner | Pullom Ora | $127,135 |
Source: Public Records
Tax History
| Year | Tax Paid | Tax Assessment Tax Assessment Total Assessment is a certain percentage of the fair market value that is determined by local assessors to be the total taxable value of land and additions on the property. | Land | Improvement |
|---|---|---|---|---|
| 2025 | $3,885 | $110,440 | $8,800 | $101,640 |
| 2024 | $2,082 | $110,440 | $8,800 | $101,640 |
| 2023 | $2,253 | $62,400 | $8,800 | $53,600 |
| 2022 | $2,094 | $62,400 | $8,800 | $53,600 |
| 2021 | $2,108 | $62,400 | $8,800 | $53,600 |
| 2020 | $2,150 | $62,798 | $8,800 | $53,998 |
| 2019 | $1,876 | $55,281 | $5,600 | $49,681 |
| 2018 | $1,567 | $47,656 | $5,600 | $42,056 |
| 2017 | $1,348 | $42,193 | $5,600 | $36,593 |
| 2016 | $1,266 | $40,188 | $5,600 | $34,588 |
| 2015 | $1,261 | $0 | $0 | $0 |
| 2014 | $758 | $28,085 | $5,600 | $22,485 |
Source: Public Records
Map
Nearby Homes
- 3839 Teton Pass
- 3868 Twin Ridge Ln
- 3777 Teton Pass
- 3700 Stagecoach Pass
- 245 Remington Trail
- 3520 Stagecoach Pass Unit 2
- 350 Roundup Trail
- 5678 Washakie Point
- 5284 Benjamin Trail
- 5747 Rex Mill Creek
- 5370 Queen Ester Ct
- 3669 Arminto Dr
- 5550 Frontier Ct Unit 2
- 5824 Rex Mill Dr Unit 3
- 3836 Rex Cir
- 5847 Pinetree Ln
- 80 Triple Crown Ln
- 5679 Jubilant Dr
- 5502 Amelia Ln
- 5861 Colonnade Dr
- 3924 Fieldway Rd Unit 11
- 3956 Fieldway Rd Unit 11
- 3914 Fieldway Rd Unit 11
- 3949 Fieldway Rd
- 3929 Fieldway Rd
- 3919 Fieldway Rd Unit 220
- 3919 Fieldway Rd Unit 157
- 3919 Fieldway Rd Unit 11
- 3957 Wilson Ridge Ct
- 5422 S Crest Ridge Dr
- 3909 Fieldway Rd
- 3949 Wilson Ridge Ct
- 3967 Fieldway Rd
- 5410 S Crest Ridge Dr
- 3974 Fieldway Rd
- 3894 Fieldway Rd
- 3992 Peachtree Farms Rd Unit 10
- 5430 S Crest Ridge Dr
- 3948 Wilson Ridge Ct
Your Personal Tour Guide
Ask me questions while you tour the home.