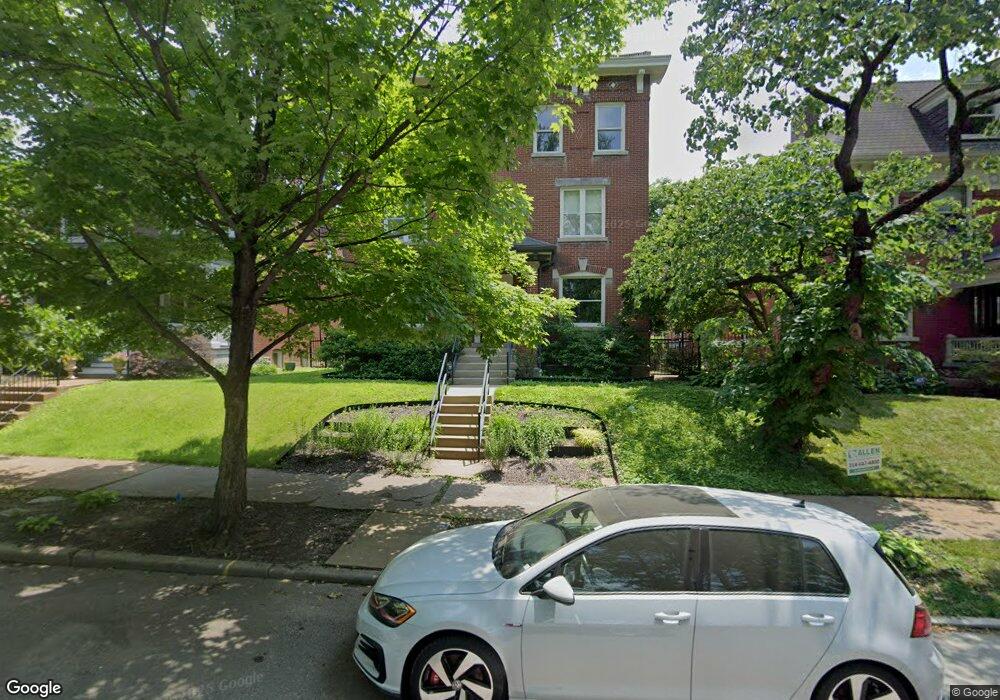
3934 Flora Place Saint Louis, MO 63110
Shaw NeighborhoodEstimated Value: $559,065 - $784,000
4
Beds
4
Baths
3,465
Sq Ft
$189/Sq Ft
Est. Value
About This Home
This home is located at 3934 Flora Place, Saint Louis, MO 63110 and is currently estimated at $655,355, approximately $189 per square foot. 3934 Flora Place is a home located in St. Louis City with nearby schools including Mann Elementary School, Roosevelt High School, and Momentum Academy Tower Grove East.
Ownership History
Date
Name
Owned For
Owner Type
Purchase Details
Closed on
Apr 25, 2014
Sold by
Mitchell Leo and Mitchell Colleen
Bought by
Byrne Patrick
Current Estimated Value
Home Financials for this Owner
Home Financials are based on the most recent Mortgage that was taken out on this home.
Original Mortgage
$282,000
Outstanding Balance
$151,719
Interest Rate
4.43%
Mortgage Type
New Conventional
Estimated Equity
$503,636
Purchase Details
Closed on
May 2, 2006
Sold by
Traber Anthony A and Traber Jayne R
Bought by
Mitchell Leo and Mitchell Colleen
Purchase Details
Closed on
Nov 22, 2002
Sold by
Leopold Jeff R and Leopold Elaine
Bought by
Traber Anthony A and Traber Jayne R
Home Financials for this Owner
Home Financials are based on the most recent Mortgage that was taken out on this home.
Original Mortgage
$179,450
Interest Rate
6.13%
Mortgage Type
Purchase Money Mortgage
Create a Home Valuation Report for This Property
The Home Valuation Report is an in-depth analysis detailing your home's value as well as a comparison with similar homes in the area
Home Values in the Area
Average Home Value in this Area
Purchase History
| Date | Buyer | Sale Price | Title Company |
|---|---|---|---|
| Byrne Patrick | -- | Benchmark Title Llc | |
| Mitchell Leo | -- | Freedom Title Llc | |
| Traber Anthony A | -- | -- |
Source: Public Records
Mortgage History
| Date | Status | Borrower | Loan Amount |
|---|---|---|---|
| Open | Byrne Patrick | $282,000 | |
| Previous Owner | Traber Anthony A | $179,450 |
Source: Public Records
Tax History Compared to Growth
Tax History
| Year | Tax Paid | Tax Assessment Tax Assessment Total Assessment is a certain percentage of the fair market value that is determined by local assessors to be the total taxable value of land and additions on the property. | Land | Improvement |
|---|---|---|---|---|
| 2025 | $7,318 | $86,160 | $5,130 | $81,030 |
| 2024 | $6,997 | $78,130 | $5,130 | $73,000 |
| 2023 | $6,997 | $78,130 | $5,130 | $73,000 |
| 2022 | $6,039 | $72,720 | $5,130 | $67,590 |
| 2021 | $6,530 | $72,720 | $5,130 | $67,590 |
| 2020 | $6,220 | $69,500 | $5,130 | $64,370 |
| 2019 | $6,200 | $69,500 | $5,130 | $64,370 |
| 2018 | $6,081 | $61,960 | $5,130 | $56,830 |
| 2017 | $5,986 | $65,950 | $5,130 | $60,820 |
| 2016 | $5,226 | $56,050 | $5,130 | $50,920 |
| 2015 | $5,612 | $66,980 | $5,130 | $61,850 |
| 2014 | $5,652 | $69,940 | $5,130 | $64,810 |
| 2013 | -- | $67,560 | $5,130 | $62,430 |
Source: Public Records
Map
Nearby Homes
- 4006 Russell Blvd
- 4011 Cleveland Ave
- 3912 Shenandoah Ave
- 3822 Cleveland Ave
- 4051 Russell Blvd
- 3957 Shaw Blvd
- 3830 Shaw Blvd Unit A
- 3910 Botanical Ave
- 3904 Botanical Ave
- 3968 Botanical Ave
- 3671 Russell Blvd
- 3828 Botanical Ave
- 3634 Flad Ave
- 3850 de Tonty St
- 3630 Flad Ave
- 4139 Russell Blvd
- 3629 Russell Blvd
- 3612 Flad Ave
- 1817 Thurman Ave
- 2211 S Grand Blvd Unit 302
- 3938 Flora Place
- 3928 Flora Place
- 3942 Flora Place
- 3924 Flora Place
- 3935 Flad Ave
- 3933 Flad Ave
- 3948 Flora Place
- 3918 Flora Place
- 3939 Flad Ave
- 3931 Flad Ave
- 3941 Flad Ave
- 3927 Flad Ave
- 3945 Flad Ave
- 3923 Flad Ave
- 3919 Flad Ave
- 3912 Flora Place
- 3954 Flora Place
- 3949 Flad Ave
- 3917 Flad Ave
- 3917 Flad Ave