Estimated Value: $410,000 - $441,000
3
Beds
2
Baths
2,414
Sq Ft
$177/Sq Ft
Est. Value
About This Home
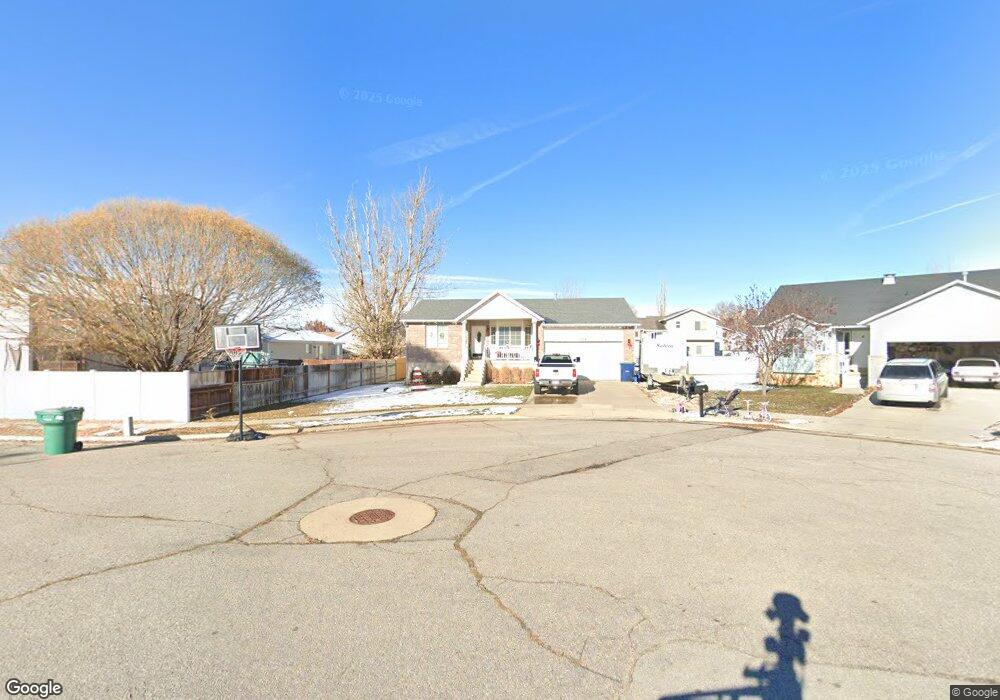
This home is located at 3934 W 4700 S, Roy, UT 84067 and is currently estimated at $428,208, approximately $177 per square foot. 3934 W 4700 S is a home located in Weber County with nearby schools including West Haven School, Sand Ridge Junior High School, and Roy High School.
Ownership History
Date
Name
Owned For
Owner Type
Purchase Details
Closed on
Oct 12, 2019
Sold by
Condon Michael J and Condon Nicole L
Bought by
Harris Dax and Harris Racall Carter
Current Estimated Value
Home Financials for this Owner
Home Financials are based on the most recent Mortgage that was taken out on this home.
Original Mortgage
$274,829
Outstanding Balance
$239,919
Interest Rate
3.33%
Mortgage Type
FHA
Estimated Equity
$188,289
Purchase Details
Closed on
Jun 26, 2008
Sold by
Romelfanger Eric P
Bought by
Condon Michael J and Condon Nicole L
Home Financials for this Owner
Home Financials are based on the most recent Mortgage that was taken out on this home.
Original Mortgage
$181,827
Interest Rate
5.99%
Mortgage Type
VA
Purchase Details
Closed on
Dec 31, 1996
Sold by
Haskell Homes Inc
Bought by
Romelfanger Eric P
Home Financials for this Owner
Home Financials are based on the most recent Mortgage that was taken out on this home.
Original Mortgage
$106,312
Interest Rate
7.53%
Mortgage Type
VA
Create a Home Valuation Report for This Property
The Home Valuation Report is an in-depth analysis detailing your home's value as well as a comparison with similar homes in the area
Home Values in the Area
Average Home Value in this Area
Purchase History
| Date | Buyer | Sale Price | Title Company |
|---|---|---|---|
| Harris Dax | -- | None Available | |
| Condon Michael J | -- | Equity Title Layton | |
| Romelfanger Eric P | -- | Security Title |
Source: Public Records
Mortgage History
| Date | Status | Borrower | Loan Amount |
|---|---|---|---|
| Open | Harris Dax | $274,829 | |
| Previous Owner | Condon Michael J | $181,827 | |
| Previous Owner | Romelfanger Eric P | $106,312 |
Source: Public Records
Tax History Compared to Growth
Tax History
| Year | Tax Paid | Tax Assessment Tax Assessment Total Assessment is a certain percentage of the fair market value that is determined by local assessors to be the total taxable value of land and additions on the property. | Land | Improvement |
|---|---|---|---|---|
| 2025 | $2,612 | $414,021 | $126,155 | $287,866 |
| 2024 | $2,549 | $223,849 | $69,385 | $154,464 |
| 2023 | $2,442 | $214,500 | $67,151 | $147,349 |
| 2022 | $2,501 | $226,600 | $59,551 | $167,049 |
| 2021 | $2,058 | $306,000 | $78,213 | $227,787 |
| 2020 | $2,000 | $274,000 | $78,213 | $195,787 |
| 2019 | $1,918 | $247,000 | $48,484 | $198,516 |
| 2018 | $1,781 | $215,000 | $40,674 | $174,326 |
| 2017 | $1,619 | $182,000 | $40,674 | $141,326 |
| 2016 | $1,651 | $100,501 | $21,415 | $79,086 |
| 2015 | $1,456 | $89,935 | $21,415 | $68,520 |
| 2014 | $1,413 | $86,011 | $18,736 | $67,275 |
Source: Public Records
Map
Nearby Homes
- 4024 W 4650 S
- 4094 W 4700 S
- 4097 W 4750 S
- 4106 W 4875 S
- 4890 S 4075 W
- 3671 W 4700 S
- 3692 W 4625 S
- 3669 W 4625 S
- 4141 W 4875 S
- 4990 S 4075 W
- 3652 W 4625 S
- 3632 W 4650 S
- 3627 W 4650 S
- 4021 W 5000 S
- 3820 Foxglen Dr
- Villages Townhome Plan at Green Farm - Villages
- Poplar Plan at Highgate Cove
- Pando Plan at Highgate Cove
- 4756 S 4300 W
- 5013 S 4150 W