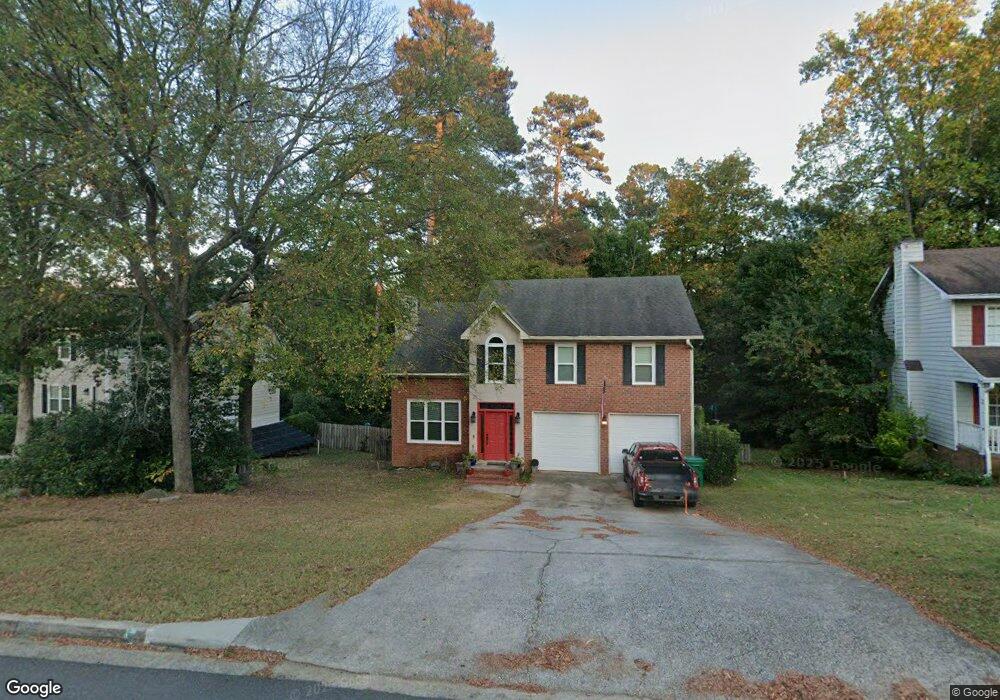
3936 Carson Cutoff Augusta, GA 30907
Estimated Value: $275,223 - $294,000
3
Beds
3
Baths
1,768
Sq Ft
$161/Sq Ft
Est. Value
About This Home
This home is located at 3936 Carson Cutoff, Augusta, GA 30907 and is currently estimated at $283,806, approximately $160 per square foot. 3936 Carson Cutoff is a home located in Columbia County with nearby schools including Blue Ridge Elementary School, Lakeside Middle School, and Lakeside High School.
Ownership History
Date
Name
Owned For
Owner Type
Purchase Details
Closed on
Jun 27, 2014
Sold by
Walton Perry J
Bought by
Feldkamp Eric J
Current Estimated Value
Home Financials for this Owner
Home Financials are based on the most recent Mortgage that was taken out on this home.
Original Mortgage
$159,082
Outstanding Balance
$121,138
Interest Rate
4.23%
Mortgage Type
VA
Estimated Equity
$162,668
Purchase Details
Closed on
Jun 1, 2007
Sold by
Pyne Gregory M
Bought by
Walton Perry J
Home Financials for this Owner
Home Financials are based on the most recent Mortgage that was taken out on this home.
Original Mortgage
$171,700
Interest Rate
6%
Mortgage Type
New Conventional
Purchase Details
Closed on
Jun 7, 2004
Sold by
Rogers Rebecca
Bought by
Pyne Gregory M
Home Financials for this Owner
Home Financials are based on the most recent Mortgage that was taken out on this home.
Original Mortgage
$134,900
Interest Rate
4.75%
Mortgage Type
Purchase Money Mortgage
Create a Home Valuation Report for This Property
The Home Valuation Report is an in-depth analysis detailing your home's value as well as a comparison with similar homes in the area
Home Values in the Area
Average Home Value in this Area
Purchase History
| Date | Buyer | Sale Price | Title Company |
|---|---|---|---|
| Feldkamp Eric J | $154,000 | -- | |
| Walton Perry J | $171,700 | -- | |
| Pyne Gregory M | $134,900 | -- |
Source: Public Records
Mortgage History
| Date | Status | Borrower | Loan Amount |
|---|---|---|---|
| Open | Feldkamp Eric J | $159,082 | |
| Previous Owner | Walton Perry J | $171,700 | |
| Previous Owner | Pyne Gregory M | $134,900 |
Source: Public Records
Tax History Compared to Growth
Tax History
| Year | Tax Paid | Tax Assessment Tax Assessment Total Assessment is a certain percentage of the fair market value that is determined by local assessors to be the total taxable value of land and additions on the property. | Land | Improvement |
|---|---|---|---|---|
| 2025 | $2,461 | $102,712 | $21,604 | $81,108 |
| 2024 | $2,507 | $99,960 | $19,804 | $80,156 |
| 2023 | $2,507 | $91,327 | $19,804 | $71,523 |
| 2022 | $2,125 | $81,483 | $16,904 | $64,579 |
| 2021 | $1,951 | $71,545 | $14,804 | $56,741 |
| 2020 | $1,892 | $67,972 | $14,304 | $53,668 |
| 2019 | $1,847 | $64,401 | $13,504 | $50,897 |
| 2018 | $1,797 | $62,406 | $12,804 | $49,602 |
| 2017 | $1,738 | $60,065 | $12,304 | $47,761 |
| 2016 | $1,798 | $64,505 | $11,380 | $53,125 |
| 2015 | $1,722 | $61,600 | $12,180 | $49,420 |
| 2014 | $1,888 | $66,894 | $11,980 | $54,914 |
Source: Public Records
Map
Nearby Homes
- 455 Bristol Rd
- 3779 Winchester Trail
- 348 Candlestick Way
- 3744 Cactus Trail
- 4116 Dunes Dr
- 0 Commons Dr
- 155 Canton Park Ave
- 4209 Fairfield Cir
- 0 Mccormick Rd Unit 547611
- 4190 Litchfield Ln
- 326 Timberidge Dr
- 3777 Pine Ridge Run
- 497 Creekwalk Cir
- 4120 Mansfield Place
- 3765 Silver Mine Bluff
- 499 Oak Chase Dr
- 343 Joshua Tree Dr
- 4106 Mansfield Place
- 500 Oak Chase Dr
- 579 Litchfield Ct
- 3938 Carson Cutoff
- 402 Carson Ct
- 404 Carson Ct
- 4078 Oregon Trail
- 3940 Carson Cutoff
- 4076 Oregon Trail
- 3931 Carson Cutoff
- 3929 Carson Cutoff
- 3942 Carson Cutoff
- 4080 Oregon Trail
- 405 Carson Ct
- 4074 Oregon Trail
- 3927 Carson Cutoff
- 3903 Loblolly Trail
- 3930 Carson Cutoff
- 3935 Carson Cutoff
- 3901 Loblolly Trail
- 3944 Carson Cutoff
- 3925 Carson Cutoff
- 403 Carson Ct