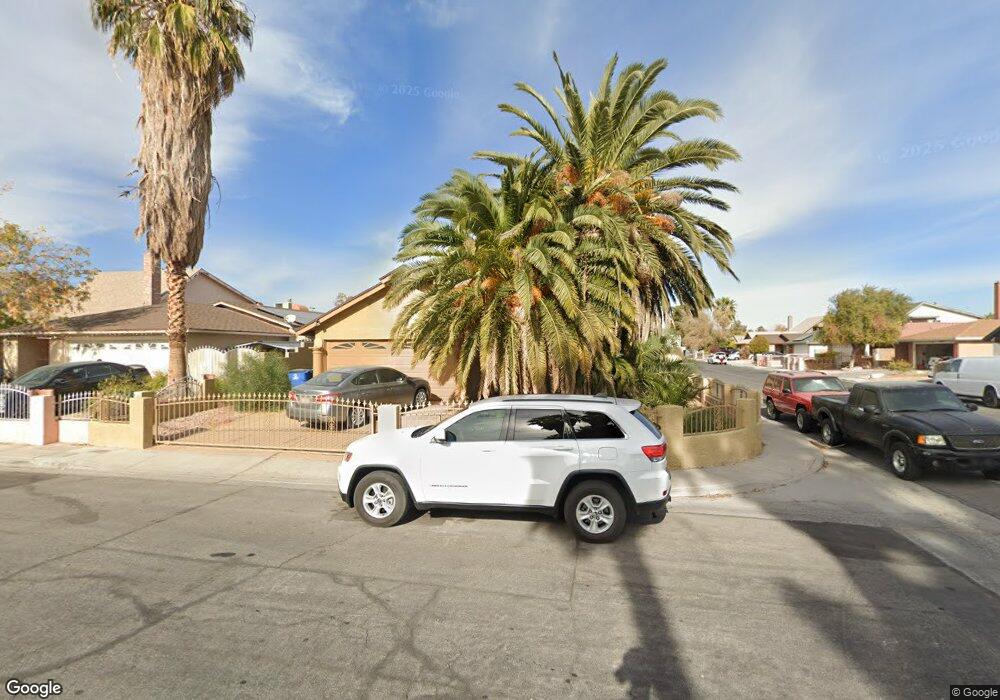
3936 Logging Ct Las Vegas, NV 89110
East Las Vegas NeighborhoodEstimated Value: $343,000 - $385,000
3
Beds
3
Baths
1,818
Sq Ft
$198/Sq Ft
Est. Value
About This Home
This home is located at 3936 Logging Ct, Las Vegas, NV 89110 and is currently estimated at $360,305, approximately $198 per square foot. 3936 Logging Ct is a home located in Clark County with nearby schools including Oran K Gragson Elementary School, Roy West Martin Middle School, and Desert Pines High School.
Ownership History
Date
Name
Owned For
Owner Type
Purchase Details
Closed on
Aug 5, 2002
Sold by
Valenzuela Maria
Bought by
Andrews William A and Andrews Grace A
Current Estimated Value
Home Financials for this Owner
Home Financials are based on the most recent Mortgage that was taken out on this home.
Original Mortgage
$139,128
Outstanding Balance
$56,809
Interest Rate
6.6%
Mortgage Type
VA
Estimated Equity
$303,496
Purchase Details
Closed on
Jul 27, 2000
Sold by
Valenzuela Enrique
Bought by
Ahumada Maria
Home Financials for this Owner
Home Financials are based on the most recent Mortgage that was taken out on this home.
Original Mortgage
$80,300
Interest Rate
8.2%
Purchase Details
Closed on
Jul 21, 2000
Sold by
Valenzuela Maria and Valenzuela Martin
Bought by
Valenzuela Maria
Home Financials for this Owner
Home Financials are based on the most recent Mortgage that was taken out on this home.
Original Mortgage
$80,300
Interest Rate
8.2%
Create a Home Valuation Report for This Property
The Home Valuation Report is an in-depth analysis detailing your home's value as well as a comparison with similar homes in the area
Home Values in the Area
Average Home Value in this Area
Purchase History
| Date | Buyer | Sale Price | Title Company |
|---|---|---|---|
| Andrews William A | $136,400 | United Title | |
| Ahumada Maria | -- | United Title | |
| Valenzuela Maria | -- | United Title |
Source: Public Records
Mortgage History
| Date | Status | Borrower | Loan Amount |
|---|---|---|---|
| Open | Andrews William A | $139,128 | |
| Previous Owner | Valenzuela Maria | $80,300 |
Source: Public Records
Tax History
| Year | Tax Paid | Tax Assessment Tax Assessment Total Assessment is a certain percentage of the fair market value that is determined by local assessors to be the total taxable value of land and additions on the property. | Land | Improvement |
|---|---|---|---|---|
| 2026 | $1,068 | $60,895 | $23,100 | $37,795 |
| 2025 | $1,036 | $60,842 | $22,050 | $38,792 |
| 2024 | $1,007 | $60,842 | $22,050 | $38,792 |
| 2023 | $1,007 | $62,689 | $24,850 | $37,839 |
| 2022 | $978 | $56,369 | $21,350 | $35,019 |
| 2021 | $949 | $52,285 | $18,550 | $33,735 |
| 2020 | $919 | $51,343 | $17,500 | $33,843 |
| 2019 | $892 | $47,684 | $14,000 | $33,684 |
| 2018 | $866 | $44,643 | $12,128 | $32,515 |
| 2017 | $1,410 | $43,000 | $9,800 | $33,200 |
| 2016 | $821 | $40,982 | $7,000 | $33,982 |
| 2015 | $818 | $27,612 | $5,600 | $22,012 |
| 2014 | $794 | $24,174 | $4,200 | $19,974 |
Source: Public Records
Map
Nearby Homes
- 1405 N Sandhill Rd Unit 2
- 951 N Sandhill Rd
- 653 Lineshack Ln
- 628 Triest Ct
- 592 Sea Shell Ln
- 582 Blue Lagoon Dr
- 4224 Estaban Ct
- 3620 Park Oliver Dr
- 3908 Montebello Ave
- 809 Mantis Way Unit 4
- 432 Anchor St
- 543 N Lamb Blvd Unit 55
- 4013 Alameda Ave
- 3908 Alameda Ave
- 3636 Asbury Hill Ave
- 868 Parkhurst St Unit 1
- 809 Hedge Way Unit 3
- 808 Hedge Way Unit 4
- 848 Hedge Way Unit 3
- 3905 Centura Ave
- 3932 Logging Ct
- 3928 Logging Ct
- 3941 Herford Ln
- 3937 Herford Ln
- 3924 Logging Ct
- 633 Lineshack Ln
- 637 Lineshack Ln
- 641 Lineshack Ln
- 629 Lineshack Ln
- 645 Lineshack Ln
- 3937 Logging Ct
- 625 Lineshack Ln
- 3920 Logging Ct
- 3929 Herford Ln
- 3933 Logging Ct
- 3929 Logging Ct
- 649 Lineshack Ln
- 621 Lineshack Ln
- 3925 Herford Ln
- 3925 Logging Ct
Your Personal Tour Guide
Ask me questions while you tour the home.