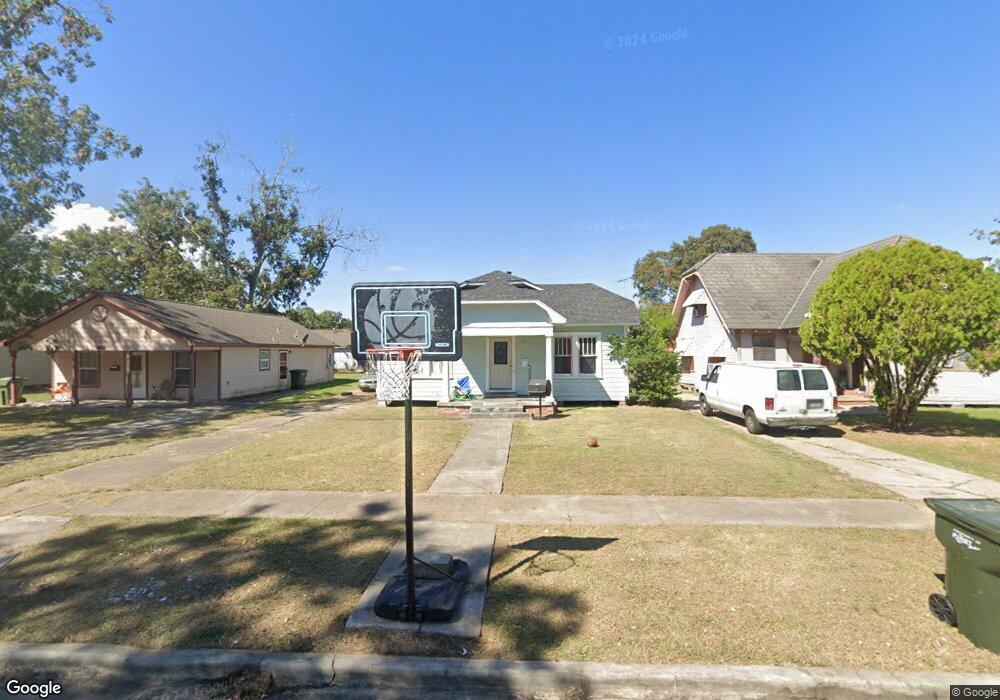
3937 4th St Port Arthur, TX 77642
Estimated Value: $85,783 - $161,000
3
Beds
2
Baths
1,476
Sq Ft
$77/Sq Ft
Est. Value
About This Home
This home is located at 3937 4th St, Port Arthur, TX 77642 and is currently estimated at $113,196, approximately $76 per square foot. 3937 4th St is a home located in Jefferson County with nearby schools including Lakeview Elementary School, Jefferson Middle School, and Memorial High School.
Ownership History
Date
Name
Owned For
Owner Type
Purchase Details
Closed on
May 16, 2025
Sold by
E-Advantage Inc
Bought by
Xore Capital Llc
Current Estimated Value
Home Financials for this Owner
Home Financials are based on the most recent Mortgage that was taken out on this home.
Original Mortgage
$454,372
Outstanding Balance
$452,818
Interest Rate
6.83%
Mortgage Type
Credit Line Revolving
Estimated Equity
-$339,622
Purchase Details
Closed on
Oct 6, 2014
Sold by
Estes Mack
Bought by
Checkmate Investments Llc
Create a Home Valuation Report for This Property
The Home Valuation Report is an in-depth analysis detailing your home's value as well as a comparison with similar homes in the area
Home Values in the Area
Average Home Value in this Area
Purchase History
| Date | Buyer | Sale Price | Title Company |
|---|---|---|---|
| Xore Capital Llc | -- | Corporation Service | |
| E-Advantage Inc | -- | None Listed On Document | |
| Checkmate Investments Llc | -- | None Available |
Source: Public Records
Mortgage History
| Date | Status | Borrower | Loan Amount |
|---|---|---|---|
| Open | Xore Capital Llc | $454,372 |
Source: Public Records
Tax History Compared to Growth
Tax History
| Year | Tax Paid | Tax Assessment Tax Assessment Total Assessment is a certain percentage of the fair market value that is determined by local assessors to be the total taxable value of land and additions on the property. | Land | Improvement |
|---|---|---|---|---|
| 2025 | $2,313 | $81,332 | $6,750 | $74,582 |
| 2024 | $2,313 | $80,735 | $2,910 | $77,825 |
| 2023 | $2,313 | $71,007 | $2,910 | $68,097 |
| 2022 | $2,255 | $71,007 | $2,910 | $68,097 |
| 2021 | $2,727 | $82,281 | $2,910 | $79,371 |
| 2020 | $750 | $24,831 | $2,910 | $21,921 |
| 2019 | $738 | $23,140 | $2,910 | $20,230 |
| 2018 | $738 | $23,140 | $2,910 | $20,230 |
| 2017 | $717 | $23,140 | $2,910 | $20,230 |
| 2016 | $678 | $23,140 | $2,910 | $20,230 |
| 2015 | $791 | $23,140 | $2,910 | $20,230 |
| 2014 | $791 | $26,510 | $2,910 | $23,600 |
Source: Public Records
Map
Nearby Homes