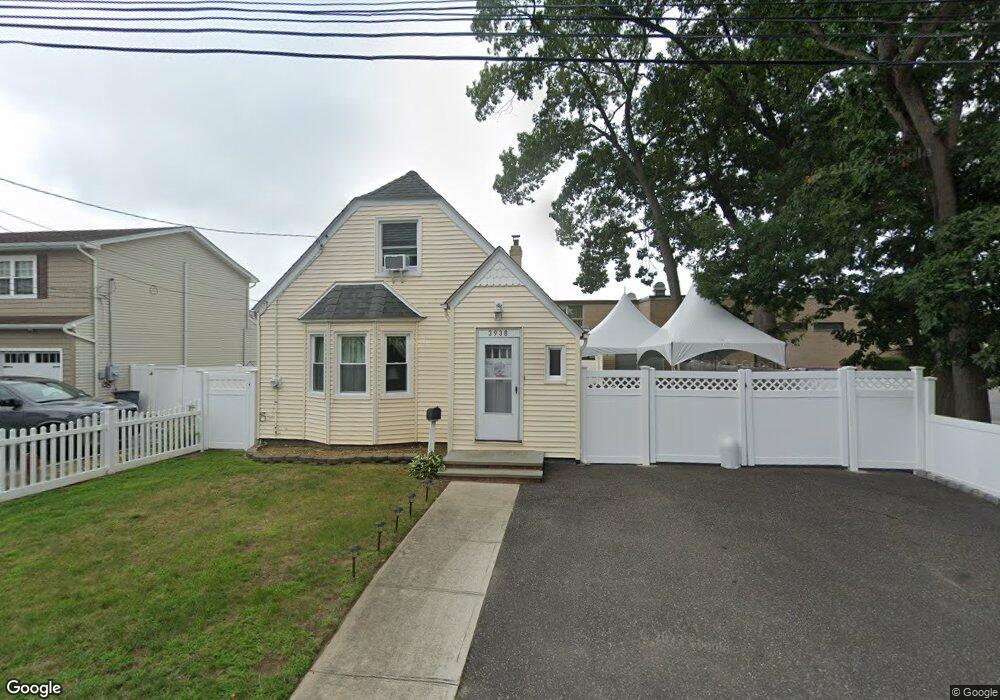
3938 Gilmartin Ln Seaford, NY 11783
Estimated Value: $596,000 - $597,860
3
Beds
1
Bath
942
Sq Ft
$634/Sq Ft
Est. Value
About This Home
This home is located at 3938 Gilmartin Ln, Seaford, NY 11783 and is currently estimated at $596,930, approximately $633 per square foot. 3938 Gilmartin Ln is a home located in Nassau County with nearby schools including Seaford Middle School, Seaford Senior High School, and St. William the Abbot School.
Ownership History
Date
Name
Owned For
Owner Type
Purchase Details
Closed on
Jun 28, 2021
Sold by
Laurendi Robert and Laurendi Caroline
Bought by
Rogala Robert and Rogala Daniela
Current Estimated Value
Home Financials for this Owner
Home Financials are based on the most recent Mortgage that was taken out on this home.
Original Mortgage
$400,300
Interest Rate
2.9%
Mortgage Type
New Conventional
Purchase Details
Closed on
Feb 22, 2005
Sold by
Beaudreau Paul
Bought by
Laurendi Robert
Purchase Details
Closed on
Apr 26, 2002
Sold by
Donohue James and Donohue Dennis
Bought by
Beaudreau Anne and Beaudreau Paul
Purchase Details
Closed on
May 28, 1999
Sold by
Donohue James
Bought by
Donohue James and Donohue Dennis
Purchase Details
Closed on
Jul 24, 1995
Sold by
Wergeles Warren and Wergeles Patricia
Bought by
Donohue James
Create a Home Valuation Report for This Property
The Home Valuation Report is an in-depth analysis detailing your home's value as well as a comparison with similar homes in the area
Home Values in the Area
Average Home Value in this Area
Purchase History
| Date | Buyer | Sale Price | Title Company |
|---|---|---|---|
| Rogala Robert | $444,822 | None Available | |
| Laurendi Robert | $375,000 | -- | |
| Beaudreau Anne | $162,000 | Michael Biggiani | |
| Donohue James | -- | First American Title Ins Co | |
| Donohue James | $142,000 | -- |
Source: Public Records
Mortgage History
| Date | Status | Borrower | Loan Amount |
|---|---|---|---|
| Previous Owner | Rogala Robert | $400,300 |
Source: Public Records
Tax History Compared to Growth
Tax History
| Year | Tax Paid | Tax Assessment Tax Assessment Total Assessment is a certain percentage of the fair market value that is determined by local assessors to be the total taxable value of land and additions on the property. | Land | Improvement |
|---|---|---|---|---|
| 2025 | $10,514 | $352 | $164 | $188 |
| 2024 | $2,934 | $385 | $179 | $206 |
| 2023 | $10,673 | $385 | $179 | $206 |
| 2022 | $10,673 | $385 | $179 | $206 |
| 2021 | $10,073 | $378 | $176 | $202 |
| 2020 | $9,473 | $517 | $500 | $17 |
| 2019 | $2,545 | $517 | $500 | $17 |
| 2018 | $6,444 | $574 | $0 | $0 |
| 2017 | $6,399 | $574 | $464 | $110 |
| 2016 | $9,008 | $574 | $464 | $110 |
| 2015 | $2,896 | $686 | $555 | $131 |
| 2014 | $2,896 | $686 | $555 | $131 |
| 2013 | $2,716 | $686 | $555 | $131 |
Source: Public Records
Map
Nearby Homes
- 3861 Wilburne Ave
- 2067 Jackson Ave
- 3969 Marlow Ct
- 3945 Hickory St
- 4037 Park Dr
- 28 Grove St
- 1823 Lincoln Ave
- 3731 Park Ave
- 3862 Clark St
- 4060 Clark St
- 1716 Monroe Ave
- 3860 Maplewood Dr
- 36 Michigan Ave
- 3902 Beechwood Place
- 3937 John Ln
- 2327 Mattituck Ave
- 2349 S Seamans Neck Rd
- 51 Michigan Ave
- 63 Pennsylvania Ave
- 3615 Franklin St
- 3946 Gilmartin Ln
- 3937 Gilmartin Ln
- 3949 Gilmartin Ln
- 3943 Gilmartin Ln
- 3925 Gilmartin Ln
- 1980 Washington Ave
- 1971 Jackson Ave
- 1982 Washington Ave
- 1965 Jackson Ave
- 1982 Jackson Ave
- 3945 Baylis Rd
- 1966 Jackson Ave
- 3949 Baylis Rd
- 3955 Baylis Rd
- 1984 Washington Ave
- 3963 Baylis Rd
- 1972 Washington Ave
- 3900 Sunrise Hwy
- 3900 Sunrise Hwy Unit 1
- 1976 Washington Ave