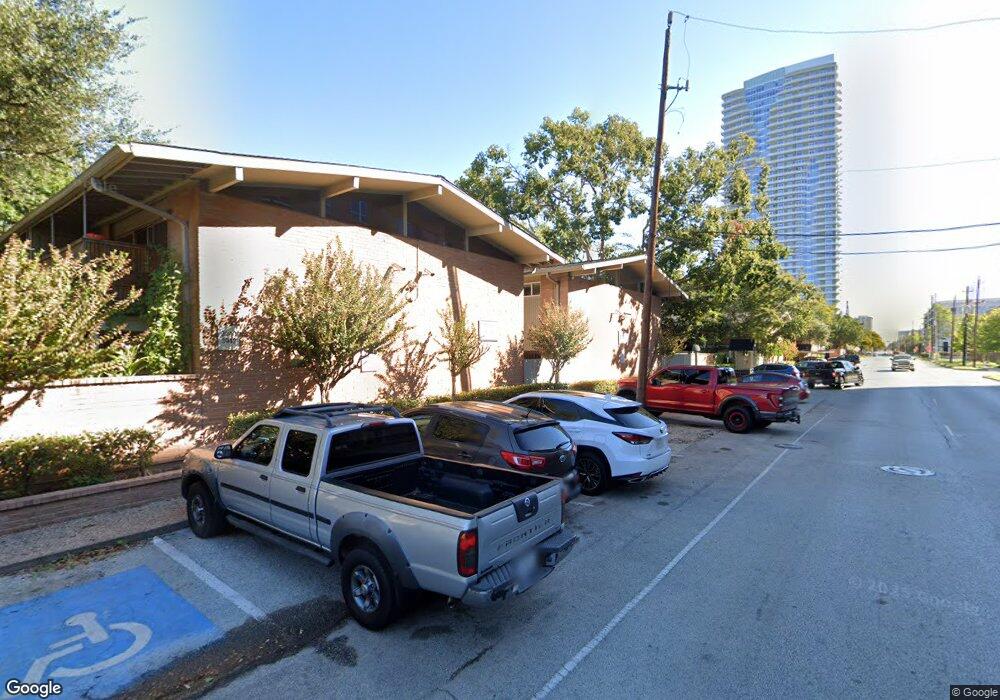
3938 W West Alabama Unit 6 Houston, TX 77027
Afton Oaks NeighborhoodEstimated Value: $146,000 - $172,000
1
Bed
1
Bath
630
Sq Ft
$245/Sq Ft
Est. Value
About This Home
This home is located at 3938 W West Alabama Unit 6, Houston, TX 77027 and is currently estimated at $154,507, approximately $245 per square foot. 3938 W West Alabama Unit 6 is a home located in Harris County with nearby schools including School at St. George Place, Lanier Middle School, and Lamar High School.
Ownership History
Date
Name
Owned For
Owner Type
Purchase Details
Closed on
Mar 19, 2015
Sold by
Cyc Consulting
Bought by
Bontemps Maxime S
Current Estimated Value
Home Financials for this Owner
Home Financials are based on the most recent Mortgage that was taken out on this home.
Original Mortgage
$75,000
Outstanding Balance
$57,864
Interest Rate
3.88%
Mortgage Type
New Conventional
Estimated Equity
$96,643
Purchase Details
Closed on
Jul 14, 2014
Sold by
Champine Julia and French Steven A
Bought by
Consulting Cyc
Purchase Details
Closed on
Jun 2, 1999
Sold by
Vincent Howard R
Bought by
Champine Julia and French Steven A
Home Financials for this Owner
Home Financials are based on the most recent Mortgage that was taken out on this home.
Original Mortgage
$29,625
Interest Rate
6.91%
Create a Home Valuation Report for This Property
The Home Valuation Report is an in-depth analysis detailing your home's value as well as a comparison with similar homes in the area
Home Values in the Area
Average Home Value in this Area
Purchase History
| Date | Buyer | Sale Price | Title Company |
|---|---|---|---|
| Bontemps Maxime S | -- | American Title Co | |
| Consulting Cyc | -- | Capital Title | |
| Champine Julia | -- | -- |
Source: Public Records
Mortgage History
| Date | Status | Borrower | Loan Amount |
|---|---|---|---|
| Open | Bontemps Maxime S | $75,000 | |
| Previous Owner | Champine Julia | $29,625 |
Source: Public Records
Tax History Compared to Growth
Tax History
| Year | Tax Paid | Tax Assessment Tax Assessment Total Assessment is a certain percentage of the fair market value that is determined by local assessors to be the total taxable value of land and additions on the property. | Land | Improvement |
|---|---|---|---|---|
| 2025 | $208 | $171,718 | $32,626 | $139,092 |
| 2024 | $208 | $178,259 | $33,869 | $144,390 |
| 2023 | $208 | $172,871 | $32,845 | $140,026 |
| 2022 | $3,440 | $156,248 | $29,687 | $126,561 |
| 2021 | $3,668 | $157,386 | $29,903 | $127,483 |
| 2020 | $3,811 | $157,386 | $29,903 | $127,483 |
| 2019 | $3,805 | $157,386 | $29,903 | $127,483 |
| 2018 | $2,479 | $136,707 | $27,646 | $109,061 |
| 2017 | $3,457 | $136,707 | $27,646 | $109,061 |
| 2016 | $3,526 | $139,429 | $26,492 | $112,937 |
| 2015 | $2,154 | $113,310 | $21,529 | $91,781 |
| 2014 | $2,154 | $83,794 | $15,921 | $67,873 |
Source: Public Records
Map
Nearby Homes
- 3924 W Alabama St Unit 1
- 3924 W Alabama St Unit 4
- 3928 W Alabama St Unit 4
- 3926 W Alabama St Unit 1
- 3944 W Alabama St Unit 12
- 3938 W Alabama St Unit 10
- 3958 W Alabama St
- 2739 Drexel Dr
- 2822 Westgrove Ln
- 2610 Westgrove Ln
- 2703 Westgrove Ln
- 2706 Eastgrove Ln
- 4214 Whitman St
- 2711 Eastgrove Ln
- 3507 Drexel Dr
- 3510 Las Palmas St
- 2902 W Lane Dr Unit A
- 3131 Cummins St Unit 79
- 3131 Cummins St Unit 86
- 3131 Cummins St Unit 18
- 3938 W West Alabama
- 3940 W Alabama St Unit 3
- 3936 W Alabama St Unit 8
- 3930 W Alabama St Unit 2
- 3922 W Alabama St Unit 5
- 3936 W Alabama St Unit 3
- 3940 W Alabama St Unit 4
- 3934 W Alabama St Unit 2
- 3922 W Alabama St Unit 7
- 3930 W Alabama St Unit 8
- 3940 W Alabama St Unit 8
- 3934 W Alabama St Unit 4
- 3930 W Alabama St Unit 3
- 3934 W Alabama St Unit 3
- 3922 W Alabama St Unit 8
- 3922 W Alabama St Unit 4
- 3922 W Alabama St Unit 3
- 3922 W Alabama St Unit 2
- 3922 W Alabama St Unit 1
- 3930 W Alabama St Unit 7