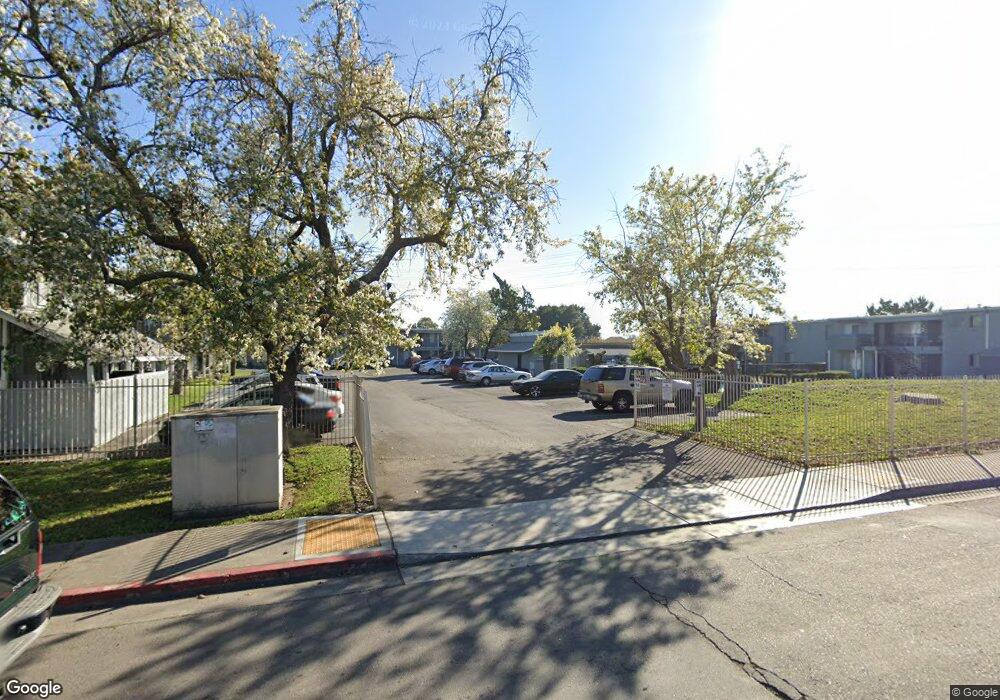
3939 N Pershing Ave Stockton, CA 95207
Lincoln Village Neighborhood
2
Beds
--
Bath
1,100
Sq Ft
124,146
Sq Ft Lot
About This Home
When you're looking to move to your new home, there's no better choice than The Residences at Brookside. We'll work with you in making this move the best move yet. You will enjoy lush landscaping within a quiet community. The Residences at Brookside is conveniently located near the Heart of Central Stockton. It is 1.5 miles from the University of Pacific, 2.2 miles from Historic Miracle Mile, and 1.5 miles from Sherwood Place and Weberstown Mall. We are within a short distance from Stagg Highschool, Inshape, and Planet Fitness, as well as many great restaurants. The Residences at Brookside is an extremely short distance from I-5, great for the commuters.
Create a Home Valuation Report for This Property
The Home Valuation Report is an in-depth analysis detailing your home's value as well as a comparison with similar homes in the area
Home Values in the Area
Average Home Value in this Area
Property History
| Date | Event | Price | List to Sale | Price per Sq Ft |
|---|---|---|---|---|
| 04/09/2025 04/09/25 | Off Market | $1,125 | -- | -- |
| 01/07/2025 01/07/25 | Price Changed | $1,125 | -6.3% | $3 / Sq Ft |
| 12/25/2024 12/25/24 | Price Changed | $1,200 | +6.7% | $3 / Sq Ft |
| 10/22/2024 10/22/24 | Price Changed | $1,125 | -6.3% | $3 / Sq Ft |
| 10/02/2024 10/02/24 | Price Changed | $1,200 | +6.7% | $3 / Sq Ft |
| 08/21/2024 08/21/24 | Price Changed | $1,125 | -6.3% | $3 / Sq Ft |
| 08/16/2024 08/16/24 | Price Changed | $1,200 | +6.7% | $3 / Sq Ft |
| 07/23/2024 07/23/24 | Price Changed | $1,125 | -6.3% | $3 / Sq Ft |
| 07/16/2024 07/16/24 | Price Changed | $1,200 | +6.7% | $3 / Sq Ft |
| 07/02/2024 07/02/24 | Price Changed | $1,125 | -6.3% | $3 / Sq Ft |
| 06/29/2024 06/29/24 | Price Changed | $1,200 | +6.7% | $3 / Sq Ft |
| 06/28/2024 06/28/24 | Price Changed | $1,125 | -6.3% | $3 / Sq Ft |
| 06/17/2024 06/17/24 | Price Changed | $1,200 | +6.7% | $3 / Sq Ft |
| 06/01/2024 06/01/24 | Price Changed | $1,125 | -6.3% | $3 / Sq Ft |
| 05/24/2024 05/24/24 | Price Changed | $1,200 | +6.7% | $3 / Sq Ft |
| 05/01/2024 05/01/24 | Price Changed | $1,125 | 0.0% | $3 / Sq Ft |
| 04/05/2024 04/05/24 | Price Changed | $1,125 | -6.3% | $3 / Sq Ft |
| 03/27/2024 03/27/24 | Price Changed | $1,200 | +6.7% | $3 / Sq Ft |
| 03/07/2024 03/07/24 | Price Changed | $1,125 | 0.0% | $3 / Sq Ft |
| 02/06/2024 02/06/24 | Price Changed | $1,125 | 0.0% | $3 / Sq Ft |
| 01/23/2024 01/23/24 | Price Changed | $1,125 | 0.0% | $3 / Sq Ft |
| 11/28/2023 11/28/23 | Price Changed | $1,125 | -6.3% | $3 / Sq Ft |
| 11/03/2023 11/03/23 | Price Changed | $1,200 | 0.0% | $3 / Sq Ft |
| 10/20/2023 10/20/23 | Price Changed | $1,200 | 0.0% | $3 / Sq Ft |
| 10/07/2023 10/07/23 | Price Changed | $1,200 | 0.0% | $3 / Sq Ft |
| 09/26/2023 09/26/23 | Price Changed | $1,200 | 0.0% | $3 / Sq Ft |
| 08/07/2023 08/07/23 | For Rent | -- | -- | -- |
| 06/21/2023 06/21/23 | For Rent | -- | -- | -- |
| 06/14/2023 06/14/23 | For Rent | -- | -- | -- |
| 05/24/2023 05/24/23 | Price Changed | $1,200 | +6.7% | $3 / Sq Ft |
| 05/23/2023 05/23/23 | Price Changed | $1,125 | -6.3% | $3 / Sq Ft |
| 05/19/2023 05/19/23 | Price Changed | $1,200 | 0.0% | $3 / Sq Ft |
| 04/18/2023 04/18/23 | Price Changed | $1,200 | 0.0% | $3 / Sq Ft |
| 03/31/2023 03/31/23 | Price Changed | $1,200 | -5.9% | $3 / Sq Ft |
| 09/21/2022 09/21/22 | Price Changed | $1,275 | +64.5% | $3 / Sq Ft |
| 09/14/2022 09/14/22 | Price Changed | $775 | -39.2% | $2 / Sq Ft |
| 08/24/2022 08/24/22 | Price Changed | $1,275 | +10.9% | $3 / Sq Ft |
| 08/23/2022 08/23/22 | For Rent | $1,150 | -- | -- |
Tax History
| Year | Tax Paid | Tax Assessment Tax Assessment Total Assessment is a certain percentage of the fair market value that is determined by local assessors to be the total taxable value of land and additions on the property. | Land | Improvement |
|---|---|---|---|---|
| 2025 | $129,739 | $6,684,968 | $1,943,979 | $4,740,989 |
| 2024 | $125,378 | $6,553,891 | $1,905,862 | $4,648,029 |
| 2023 | $124,837 | $6,425,385 | $1,868,493 | $4,556,892 |
| 2022 | $122,863 | $6,299,398 | $1,831,856 | $4,467,542 |
| 2021 | $121,882 | $6,175,882 | $1,795,938 | $4,379,944 |
| 2020 | $121,855 | $6,112,557 | $1,777,523 | $4,335,034 |
| 2019 | $82,567 | $5,992,704 | $1,742,670 | $4,250,034 |
| 2018 | $80,923 | $5,875,200 | $1,708,500 | $4,166,700 |
| 2017 | $61,356 | $4,159,742 | $668,616 | $3,491,126 |
| 2016 | $60,844 | $4,078,595 | $655,509 | $3,423,086 |
| 2014 | $59,429 | $3,145,400 | $500,000 | $2,645,400 |
Source: Public Records
Map
Nearby Homes
- 1405 Cat Tail Dr
- 1217 W Churchill St
- 1516 Fog Bank Dr
- 1109 W Churchill St
- 3833 Stepping Stone Way
- 1706 La Jolla Dr
- 1739 La Jolla Dr
- 3319 N Pershing Ave
- 1805 de Ovan Ave
- 1806 La Jolla Dr
- 1920 Pontelli Ct
- 1963 Pontelli Ct
- 1944 La Jolla Dr
- 701 W Bianchi Rd
- 1266 W Mariposa Ave
- 1071 W Monterey Ave
- 2036 La Jolla Dr
- 1060 W Monterey Ave
- 190 W Mckenzie Ave
- 4332 Pacific Ave Unit 80
- 3939 N Pershing Ave 1x1
- 3939 N Pershing Ave 1x1s
- 1303 Brookside Rd
- 4102 Crown Ave
- 4101 N Pershing Ave
- 4110 Crown Ave Unit 1
- 4109 N Pershing Ave
- 4102 N Pershing Ave
- 4114 Crown Ave
- 4113 N Pershing Ave
- 1217 Brookside Rd
- 4108 N Pershing Ave
- 4118 Crown Ave
- 1215 Brookside Rd
- 4115 N Pershing Ave
- 1218 W Churchill St Unit 1
- 4122 Crown Ave
- 4121 N Pershing Ave
- 1419 Cat Tail Dr
- 1209 Brookside Rd
Your Personal Tour Guide
Ask me questions while you tour the home.