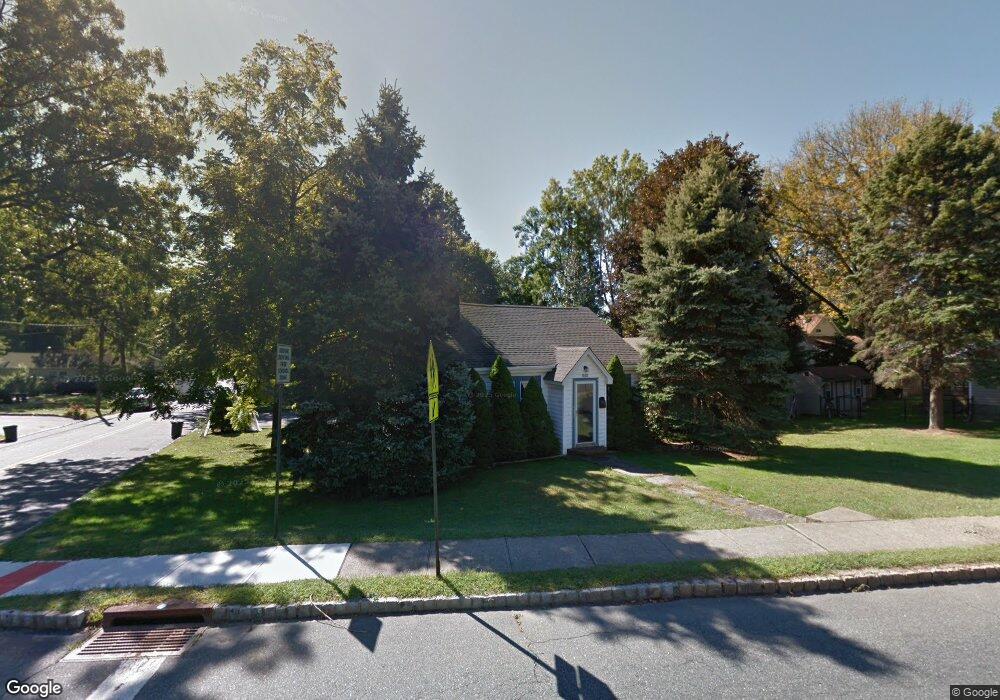
394 Allentown Rd Parsippany, NJ 07054
Estimated Value: $402,000 - $478,000
--
Bed
--
Bath
815
Sq Ft
$548/Sq Ft
Est. Value
About This Home
This home is located at 394 Allentown Rd, Parsippany, NJ 07054 and is currently estimated at $446,857, approximately $548 per square foot. 394 Allentown Rd is a home located in Morris County with nearby schools including Lake Parsippany Elementary School, Brooklawn Middle School, and Parsippany Hills High School.
Ownership History
Date
Name
Owned For
Owner Type
Purchase Details
Closed on
May 12, 2009
Sold by
Le Khan B and Nguyen Le T
Bought by
Le Khan B and Nguyen Le T
Current Estimated Value
Home Financials for this Owner
Home Financials are based on the most recent Mortgage that was taken out on this home.
Original Mortgage
$278,000
Outstanding Balance
$175,363
Interest Rate
4.82%
Mortgage Type
Stand Alone First
Estimated Equity
$271,494
Purchase Details
Closed on
Jul 24, 2007
Sold by
Zeak Michael J and Zeak Ann T
Bought by
Le Khanh B and Nguyen Le T
Home Financials for this Owner
Home Financials are based on the most recent Mortgage that was taken out on this home.
Original Mortgage
$274,550
Interest Rate
6.73%
Mortgage Type
Purchase Money Mortgage
Purchase Details
Closed on
Mar 8, 2002
Sold by
Carter Mark
Bought by
Zeak Michael
Home Financials for this Owner
Home Financials are based on the most recent Mortgage that was taken out on this home.
Original Mortgage
$172,900
Interest Rate
6.91%
Create a Home Valuation Report for This Property
The Home Valuation Report is an in-depth analysis detailing your home's value as well as a comparison with similar homes in the area
Home Values in the Area
Average Home Value in this Area
Purchase History
| Date | Buyer | Sale Price | Title Company |
|---|---|---|---|
| Le Khan B | -- | Fidelity Natl Title Ins Co | |
| Le Khanh B | $323,000 | Fidelity Natl Title Ins Co | |
| Zeak Michael | $182,000 | -- |
Source: Public Records
Mortgage History
| Date | Status | Borrower | Loan Amount |
|---|---|---|---|
| Open | Le Khan B | $278,000 | |
| Closed | Le Khanh B | $274,550 | |
| Previous Owner | Zeak Michael | $172,900 |
Source: Public Records
Tax History Compared to Growth
Tax History
| Year | Tax Paid | Tax Assessment Tax Assessment Total Assessment is a certain percentage of the fair market value that is determined by local assessors to be the total taxable value of land and additions on the property. | Land | Improvement |
|---|---|---|---|---|
| 2025 | $6,355 | $183,500 | $125,500 | $58,000 |
| 2024 | $6,234 | $183,500 | $125,500 | $58,000 |
| 2023 | $6,234 | $183,500 | $125,500 | $58,000 |
| 2022 | $5,815 | $183,500 | $125,500 | $58,000 |
| 2021 | $5,815 | $183,500 | $125,500 | $58,000 |
| 2020 | $5,677 | $183,500 | $125,500 | $58,000 |
| 2019 | $5,525 | $183,500 | $125,500 | $58,000 |
| 2018 | $5,404 | $183,500 | $125,500 | $58,000 |
| 2017 | $5,283 | $183,500 | $125,500 | $58,000 |
| 2016 | $5,191 | $183,500 | $125,500 | $58,000 |
| 2015 | $5,054 | $183,500 | $125,500 | $58,000 |
| 2014 | $4,988 | $183,500 | $125,500 | $58,000 |
Source: Public Records
Map
Nearby Homes
- 417 Allentown Rd
- 59 Kingston Rd
- 206 Atlantic Dr
- 10 Buena Rd
- 14 Braemar Ct
- 91 Farmingdale Dr
- 1035 Littleton Rd
- 32 Hardwick Ct
- 115 Northfield Rd
- 21 Dolly Dr
- 260 Everett Rd
- 14 Willow Ln
- 9 Craydon St
- Rockefeller with Library Plan at Parq
- Rockefeller Plan at Parq
- 51 Willow Ln
- 44 Willow Ln
- 49 Willow Ln
- 3 Queen St
- 189 Littleton Rd Unit 41
- 105 Atlantic Dr
- 404 Allentown Rd
- 118 Bridgeton Dr
- 97 Atlantic Dr
- 112 Bridgeton Dr
- 389 Allentown Rd
- 384 Allentown Rd
- 395 Allentown Rd
- 385 Allentown Rd
- 104 Bridgeton Dr
- 399 Allentown Rd
- 91 Atlantic Dr
- 98 Atlantic Dr
- 381 Allentown Rd
- 405 Allentown Rd
- 129 Atlantic Dr
- 100 Bridgeton Dr
- 113 Bridgeton Dr
- 90 Atlantic Dr
- 128 Atlantic Dr