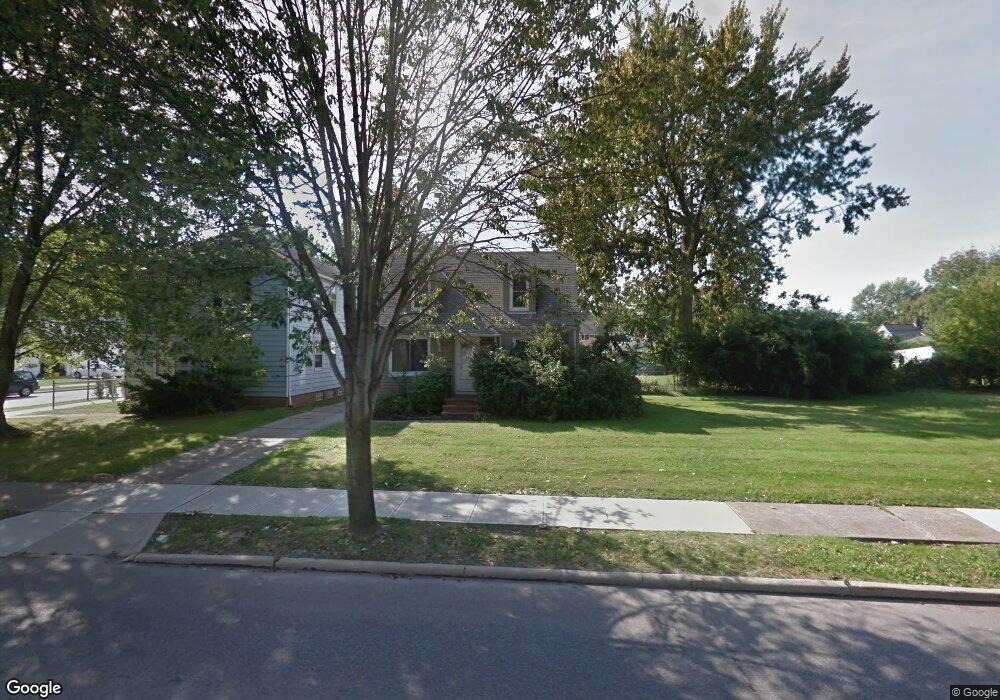
394 E 250th St Euclid, OH 44132
Estimated Value: $133,929 - $156,000
3
Beds
1
Bath
1,362
Sq Ft
$110/Sq Ft
Est. Value
About This Home
This home is located at 394 E 250th St, Euclid, OH 44132 and is currently estimated at $150,232, approximately $110 per square foot. 394 E 250th St is a home located in Cuyahoga County with nearby schools including Shoreview Elementary School, Euclid High School, and Our Lady Of The Lake School.
Ownership History
Date
Name
Owned For
Owner Type
Purchase Details
Closed on
Apr 12, 2002
Sold by
Salajcik Peggy and Salajcik Peggy A
Bought by
Salajcik Anthony M
Current Estimated Value
Purchase Details
Closed on
Aug 6, 1999
Sold by
Fioritto Mary Ann
Bought by
Salajcik Peggy A
Home Financials for this Owner
Home Financials are based on the most recent Mortgage that was taken out on this home.
Original Mortgage
$70,500
Outstanding Balance
$18,070
Interest Rate
7.7%
Estimated Equity
$132,162
Purchase Details
Closed on
Nov 9, 1976
Sold by
Fioritto Henry J and Fioritto Mary A
Bought by
Fioritto Mary Ann
Purchase Details
Closed on
Jan 1, 1975
Bought by
Fioritto Henry J and Fioritto Mary A
Create a Home Valuation Report for This Property
The Home Valuation Report is an in-depth analysis detailing your home's value as well as a comparison with similar homes in the area
Home Values in the Area
Average Home Value in this Area
Purchase History
| Date | Buyer | Sale Price | Title Company |
|---|---|---|---|
| Salajcik Anthony M | -- | -- | |
| Salajcik Peggy A | $77,500 | Executive Title Agency Corp | |
| Fioritto Mary Ann | -- | -- | |
| Fioritto Henry J | -- | -- |
Source: Public Records
Mortgage History
| Date | Status | Borrower | Loan Amount |
|---|---|---|---|
| Open | Salajcik Peggy A | $70,500 |
Source: Public Records
Tax History
| Year | Tax Paid | Tax Assessment Tax Assessment Total Assessment is a certain percentage of the fair market value that is determined by local assessors to be the total taxable value of land and additions on the property. | Land | Improvement |
|---|---|---|---|---|
| 2025 | $2,885 | $43,120 | $8,400 | $34,720 |
| 2024 | $2,975 | $43,120 | $8,400 | $34,720 |
| 2023 | $2,513 | $28,840 | $6,020 | $22,820 |
| 2022 | $2,456 | $28,840 | $6,020 | $22,820 |
| 2021 | $2,734 | $28,840 | $6,020 | $22,820 |
| 2020 | $2,592 | $24,850 | $5,180 | $19,670 |
| 2019 | $2,330 | $71,000 | $14,800 | $56,200 |
| 2018 | $2,322 | $24,850 | $5,180 | $19,670 |
| 2017 | $2,485 | $21,950 | $4,310 | $17,640 |
| 2016 | $2,490 | $21,950 | $4,310 | $17,640 |
| 2015 | $2,268 | $21,950 | $4,310 | $17,640 |
| 2014 | $2,268 | $21,950 | $4,310 | $17,640 |
Source: Public Records
Map
Nearby Homes
- 24891 Zeman Ave
- 25151 Zeman Ave
- 324 E 248th St
- 344 E 246th St
- 464 E 250th St
- 25101 Farringdon Ave
- 325 E 244th St
- 25401 Farringdon Ave
- 25731 Zeman Ave
- 276 E 242nd St
- 25370 Drakefield Ave
- 25671 Farringdon Ave
- 25591 Forestview Ave
- 295 E 238th St
- 271 E 238th St
- 355 E 257th St
- 563 E 260th St
- 571 E 260th St
- 325 E 257th St
- 328 E 238th St
- 396 E 250th St
- 386 E 250th St
- 380 E 250th St
- 404 E 250th St
- 367 E 248th St
- 375 E 248th St
- 365 E 248th St
- 376 E 250th St
- 361 E 248th St
- 410 E 250th St
- 357 E 248th St
- 24900 Shoreview Ave
- 397 E 250th St
- 399 E 250th St
- 401 E 250th St
- 374 E 250th St
- 393 E 250th St
- 403 E 250th St
- 24890 Shoreview Ave
- 391 E 250th St
Your Personal Tour Guide
Ask me questions while you tour the home.