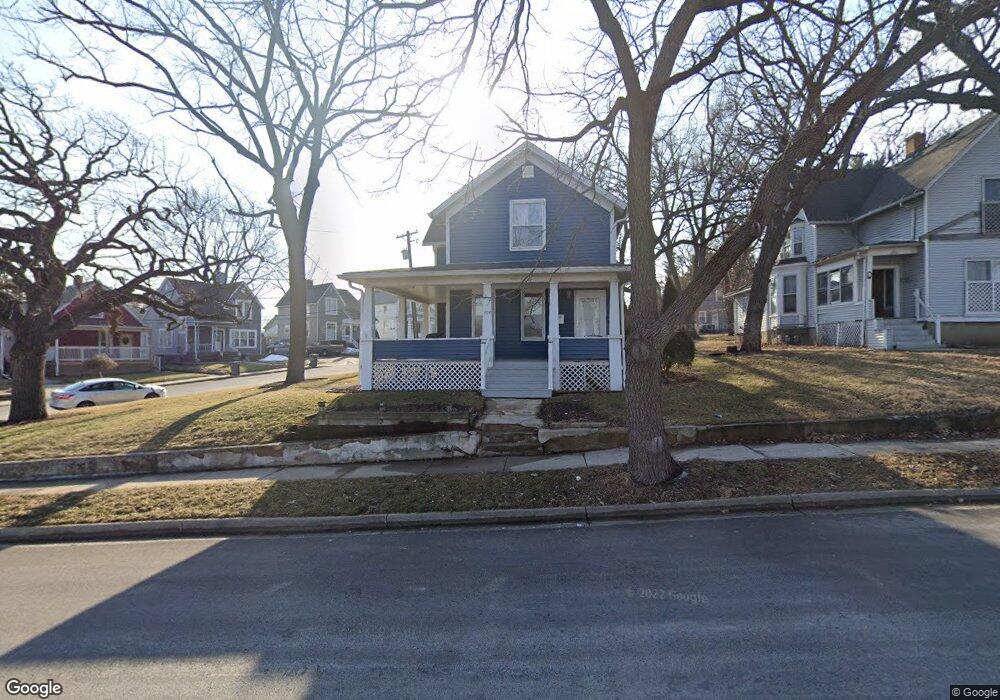
394 Hendee St Elgin, IL 60123
Southwest Elgin NeighborhoodEstimated Value: $259,227 - $278,000
3
Beds
2
Baths
1,626
Sq Ft
$163/Sq Ft
Est. Value
About This Home
This home is located at 394 Hendee St, Elgin, IL 60123 and is currently estimated at $265,307, approximately $163 per square foot. 394 Hendee St is a home located in Kane County with nearby schools including Lowrie Elementary School, Abbott Middle School, and Larkin High School.
Ownership History
Date
Name
Owned For
Owner Type
Purchase Details
Closed on
Jul 9, 2019
Sold by
Munson Dawn S
Bought by
Munson Dawn S and Dawn S Munson Revocable Living
Current Estimated Value
Purchase Details
Closed on
Apr 6, 2015
Sold by
Munson David M
Bought by
Munson Dawn S
Home Financials for this Owner
Home Financials are based on the most recent Mortgage that was taken out on this home.
Original Mortgage
$143,000
Outstanding Balance
$81,798
Interest Rate
3.75%
Mortgage Type
New Conventional
Estimated Equity
$183,509
Purchase Details
Closed on
May 14, 1998
Sold by
Houlberg Bradley C
Bought by
Munson David L and Munson Dawn S
Home Financials for this Owner
Home Financials are based on the most recent Mortgage that was taken out on this home.
Original Mortgage
$122,291
Interest Rate
7.03%
Mortgage Type
FHA
Create a Home Valuation Report for This Property
The Home Valuation Report is an in-depth analysis detailing your home's value as well as a comparison with similar homes in the area
Home Values in the Area
Average Home Value in this Area
Purchase History
| Date | Buyer | Sale Price | Title Company |
|---|---|---|---|
| Munson Dawn S | -- | Attorney | |
| Munson Dawn S | -- | Chicago Title Insurance Co | |
| Munson David L | $123,500 | -- |
Source: Public Records
Mortgage History
| Date | Status | Borrower | Loan Amount |
|---|---|---|---|
| Open | Munson Dawn S | $143,000 | |
| Previous Owner | Munson David L | $122,291 |
Source: Public Records
Tax History
| Year | Tax Paid | Tax Assessment Tax Assessment Total Assessment is a certain percentage of the fair market value that is determined by local assessors to be the total taxable value of land and additions on the property. | Land | Improvement |
|---|---|---|---|---|
| 2024 | $4,865 | $68,791 | $10,688 | $58,103 |
| 2023 | $4,616 | $62,148 | $9,656 | $52,492 |
| 2022 | $4,394 | $56,669 | $8,805 | $47,864 |
| 2021 | $4,192 | $52,981 | $8,232 | $44,749 |
| 2020 | $4,066 | $50,579 | $7,859 | $42,720 |
| 2019 | $3,939 | $48,179 | $7,486 | $40,693 |
| 2018 | $3,894 | $45,387 | $7,052 | $38,335 |
| 2017 | $3,796 | $42,907 | $6,667 | $36,240 |
| 2016 | $3,605 | $39,806 | $6,185 | $33,621 |
| 2015 | -- | $36,486 | $5,669 | $30,817 |
| 2014 | -- | $36,036 | $5,599 | $30,437 |
| 2013 | -- | $36,987 | $5,747 | $31,240 |
Source: Public Records
Map
Nearby Homes
- 133 Oak St
- 462 Ashland Ave
- 7 National St Unit 7
- 3 National St Unit 3
- 331 Orange St
- 518 Raymond St
- 277 Gifford Place
- 162 Festival Ct
- 286 Villa St
- 211 Prairie St
- 408 Bowen Ct
- 453 Orchard St
- 483 Barrett St
- 96 S Crystal St
- 208 Moseley St
- 552 Walnut Ave
- 58 S Geneva St
- 408 E Chicago St
- 9 N Jackson St
- 532 South St
Your Personal Tour Guide
Ask me questions while you tour the home.