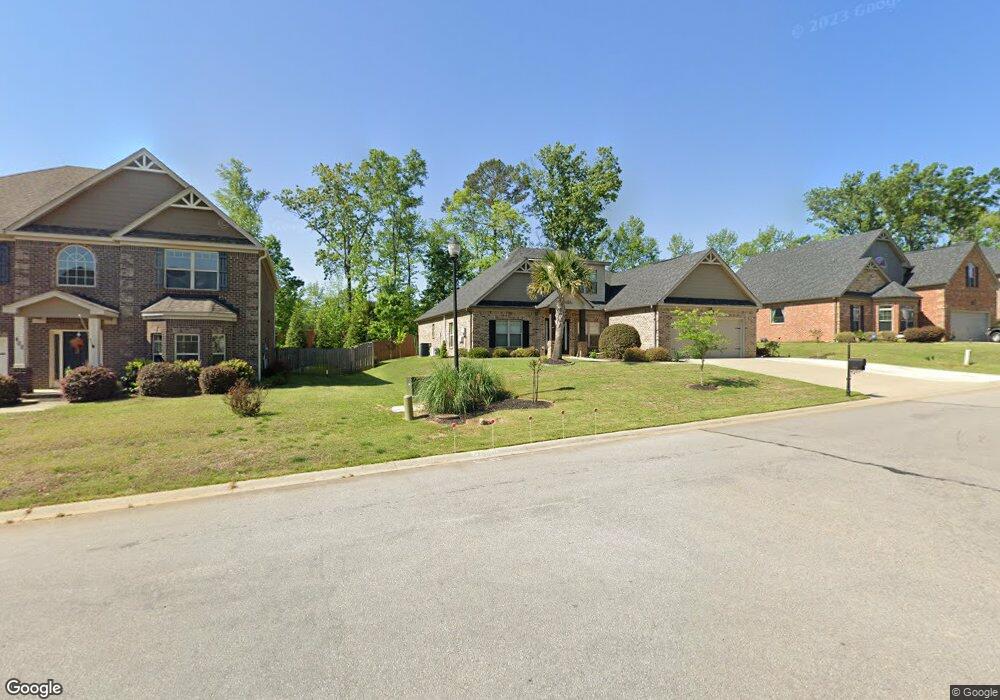
394 Hollow Cove Rd Chapin, SC 29036
Estimated Value: $353,000 - $392,444
4
Beds
3
Baths
2,634
Sq Ft
$144/Sq Ft
Est. Value
About This Home
This home is located at 394 Hollow Cove Rd, Chapin, SC 29036 and is currently estimated at $378,361, approximately $143 per square foot. 394 Hollow Cove Rd is a home located in Richland County with nearby schools including Ballentine Elementary School, Chapin Intermediate, and Chapin High School.
Ownership History
Date
Name
Owned For
Owner Type
Purchase Details
Closed on
Aug 14, 2025
Sold by
Kiser Thomas and Kiser Elena
Bought by
Kiser Thomas and Kiser Elena
Current Estimated Value
Purchase Details
Closed on
Jun 18, 2019
Sold by
Nex Ventures Realty
Bought by
Kiser Thomas and Kiser Elena
Home Financials for this Owner
Home Financials are based on the most recent Mortgage that was taken out on this home.
Original Mortgage
$232,391
Interest Rate
4.1%
Mortgage Type
VA
Purchase Details
Closed on
Oct 26, 2018
Sold by
Mcswain Amy
Bought by
Nex Ventures Realty Inc
Home Financials for this Owner
Home Financials are based on the most recent Mortgage that was taken out on this home.
Original Mortgage
$137,011
Interest Rate
4.7%
Mortgage Type
New Conventional
Purchase Details
Closed on
Aug 26, 2015
Sold by
D R Horton - Crown Llc
Bought by
Mcswain Amy
Home Financials for this Owner
Home Financials are based on the most recent Mortgage that was taken out on this home.
Original Mortgage
$246,872
Interest Rate
4.16%
Mortgage Type
New Conventional
Create a Home Valuation Report for This Property
The Home Valuation Report is an in-depth analysis detailing your home's value as well as a comparison with similar homes in the area
Home Values in the Area
Average Home Value in this Area
Purchase History
| Date | Buyer | Sale Price | Title Company |
|---|---|---|---|
| Kiser Thomas | -- | None Listed On Document | |
| Kiser Thomas | -- | None Listed On Document | |
| Kiser Thomas | $227,500 | None Available | |
| Nex Ventures Realty Inc | $179,100 | None Available | |
| Mcswain Amy | $102,384 | -- |
Source: Public Records
Mortgage History
| Date | Status | Borrower | Loan Amount |
|---|---|---|---|
| Previous Owner | Kiser Thomas | $232,391 | |
| Previous Owner | Nex Ventures Realty Inc | $137,011 | |
| Previous Owner | Mcswain Amy | $246,872 |
Source: Public Records
Tax History Compared to Growth
Tax History
| Year | Tax Paid | Tax Assessment Tax Assessment Total Assessment is a certain percentage of the fair market value that is determined by local assessors to be the total taxable value of land and additions on the property. | Land | Improvement |
|---|---|---|---|---|
| 2024 | $2,274 | $261,600 | $0 | $0 |
| 2023 | $2,186 | $9,100 | $0 | $0 |
| 2022 | $1,897 | $227,500 | $48,000 | $179,500 |
| 2021 | $1,915 | $9,100 | $0 | $0 |
| 2020 | $2,003 | $9,100 | $0 | $0 |
| 2019 | $1,890 | $8,580 | $0 | $0 |
| 2018 | $1,859 | $9,680 | $0 | $0 |
| 2017 | $1,810 | $9,680 | $0 | $0 |
| 2016 | $1,801 | $9,680 | $0 | $0 |
| 2015 | $1,472 | $2,880 | $0 | $0 |
Source: Public Records
Map
Nearby Homes
- 668 Autumn Ridge Rd
- 454 Hollow Cove Rd
- 320 Hollow Cove Rd
- 549 Everton Dr
- 445 Crawley Ln
- 420 Crawley Ln
- 297 Massey Cir
- 649 Clover View Rd
- 636 Clover View Rd
- 816 Burnview Ln
- 756 Kimsey Dr
- 205 Whitewater Dr
- 50 Steve Free Rd
- 11437 Broad River
- 203 Savannah Branch Trail
- 437 Whitewater Dr
- 133 Monroe Preserve Ln
- 114 Monroe Preserve Ln
- 109 Monroe Preserve Ln
- 149 Monroe Preserve Ln
- 390 Hollow Cove Rd
- 402 Hollow Cove Rd
- 194 Westcott Ridge Rd
- 386 Hollow Cove Rd
- 408 Hollow Cove Rd
- 195 Westcott Ridge Rd
- 387 Hollow Cove Rd
- 380 Hollow Cove Rd
- 414 Hollow Cove Rd
- 190 Westcott Ridge Rd
- 381 Hollow Cove Rd
- 374 Hollow Cove Rd
- 191 Westcott Ridge Rd
- 377 Hollow Cove Rd
- 205 Cayden Ct
- 420 Hollow Cove Rd
- 509 Everton Dr
- 505 Everton Dr
- 211 Cayden Ct
- 501 Everton Dr