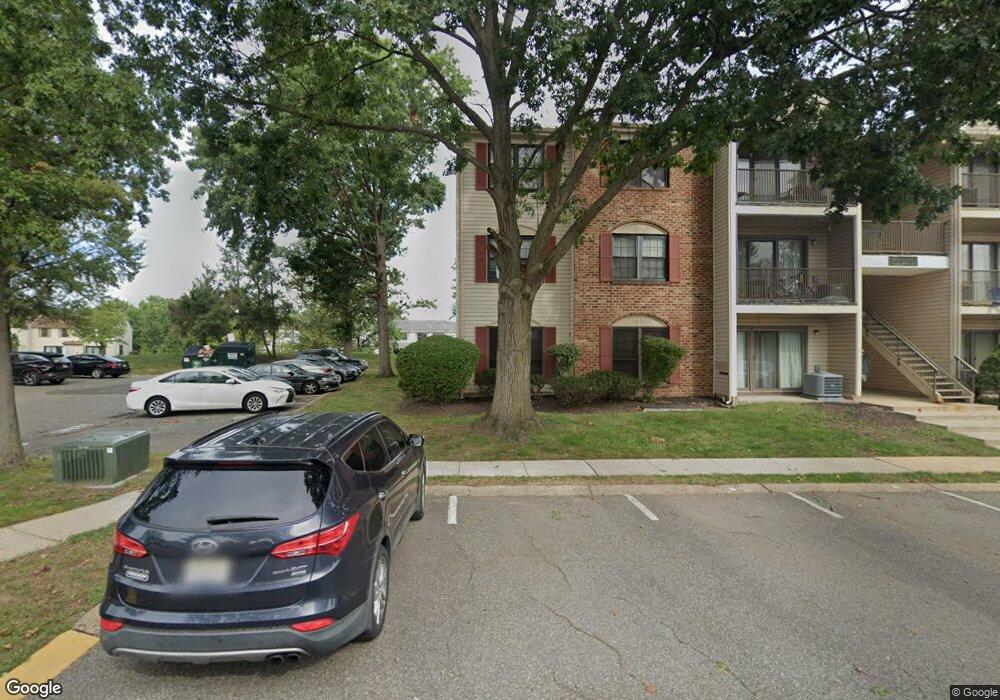
394 Lancaster Ct Piscataway, NJ 08854
Estimated Value: $393,000 - $413,000
2
Beds
2
Baths
1,200
Sq Ft
$337/Sq Ft
Est. Value
About This Home
This home is located at 394 Lancaster Ct, Piscataway, NJ 08854 and is currently estimated at $404,766, approximately $337 per square foot. 394 Lancaster Ct is a home located in Middlesex County with nearby schools including Martin Luther King Intermediate School, Randolphville Elementary School, and Conackamack Middle School.
Ownership History
Date
Name
Owned For
Owner Type
Purchase Details
Closed on
Dec 11, 2006
Sold by
Dancy Marc
Bought by
Gordon Robin
Current Estimated Value
Home Financials for this Owner
Home Financials are based on the most recent Mortgage that was taken out on this home.
Original Mortgage
$232,800
Outstanding Balance
$139,495
Interest Rate
6.35%
Estimated Equity
$265,271
Purchase Details
Closed on
Jun 1, 2005
Sold by
Starks Rebecca
Bought by
Dancy Marc and Dancy Lori
Home Financials for this Owner
Home Financials are based on the most recent Mortgage that was taken out on this home.
Original Mortgage
$180,000
Interest Rate
5.82%
Purchase Details
Closed on
Jan 5, 2001
Sold by
Rowe Albert
Bought by
Starks Rebecca
Home Financials for this Owner
Home Financials are based on the most recent Mortgage that was taken out on this home.
Original Mortgage
$112,100
Interest Rate
7.52%
Create a Home Valuation Report for This Property
The Home Valuation Report is an in-depth analysis detailing your home's value as well as a comparison with similar homes in the area
Home Values in the Area
Average Home Value in this Area
Purchase History
| Date | Buyer | Sale Price | Title Company |
|---|---|---|---|
| Gordon Robin | $240,000 | -- | |
| Dancy Marc | $225,000 | -- | |
| Starks Rebecca | $123,000 | -- |
Source: Public Records
Mortgage History
| Date | Status | Borrower | Loan Amount |
|---|---|---|---|
| Open | Gordon Robin | $232,800 | |
| Previous Owner | Dancy Marc | $180,000 | |
| Previous Owner | Starks Rebecca | $112,100 |
Source: Public Records
Tax History Compared to Growth
Tax History
| Year | Tax Paid | Tax Assessment Tax Assessment Total Assessment is a certain percentage of the fair market value that is determined by local assessors to be the total taxable value of land and additions on the property. | Land | Improvement |
|---|---|---|---|---|
| 2025 | $5,953 | $346,900 | $195,000 | $151,900 |
| 2024 | $5,762 | $304,200 | $155,000 | $149,200 |
| 2023 | $5,762 | $275,700 | $130,000 | $145,700 |
| 2022 | $5,616 | $249,400 | $110,000 | $139,400 |
| 2021 | $5,082 | $234,800 | $110,000 | $124,800 |
| 2020 | $5,298 | $226,800 | $110,000 | $116,800 |
| 2019 | $5,593 | $235,400 | $110,000 | $125,400 |
| 2018 | $5,408 | $228,000 | $110,000 | $118,000 |
| 2017 | $4,808 | $175,400 | $70,000 | $105,400 |
| 2016 | $4,718 | $175,400 | $70,000 | $105,400 |
| 2015 | $4,652 | $175,400 | $70,000 | $105,400 |
| 2014 | $4,546 | $175,400 | $70,000 | $105,400 |
Source: Public Records
Map
Nearby Homes
- 336 Lancaster Ct Unit 2336
- 352 Lancaster Ct
- 127 Berkshire Ct
- 73 Morris Ave
- 21 Thornton Ln
- 18 High Point Way
- 4 Dewey Ct
- 385 Metlars Ln
- 80 Mitchell Ave
- 76 Woodland Rd
- 148 Woodland Rd
- 131 Woodland Rd
- 110 Sylvan Ave
- 69 Redbud Rd
- 206 Overbrook Rd
- 5 Boxwood Rd
- 91 Redbud Rd
- 150 School St
- 143 School St
- 460 Sidney Rd
- 387 Lancaster Ct
- 379 Lancaster Ct
- 395 Lancaster Ct
- 386 Lancaster Ct
- 378 Lancaster Ct
- 388 Lancaster Ct
- 380 Lancaster Ct
- 397 Lancaster Ct
- 397 Lancaster Ct Unit 2397
- 396 Lancaster Ct
- 396 Lancaster Ct Unit 2396
- 389 Lancaster Ct Unit H3
- 381 Lancaster Ct
- 383 Lancaster Ct
- 383 Lancaster Ct Unit 2383
- 391 Lancaster Ct
- 399 Lancaster Ct Unit D3
- 390 Lancaster Ct
- 398 Lancaster Ct
- 398 Lancaster Ct Unit 2398