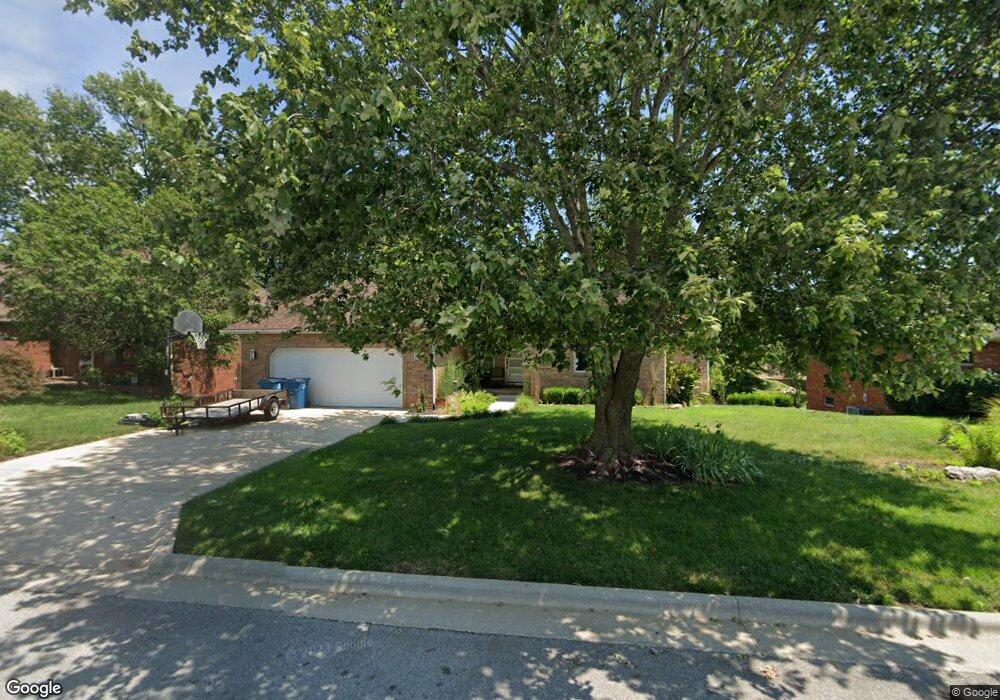
Estimated Value: $403,176 - $487,000
4
Beds
3
Baths
3,319
Sq Ft
$134/Sq Ft
Est. Value
About This Home
This home is located at 394 N Niangua Dr, Nixa, MO 65714 and is currently estimated at $446,294, approximately $134 per square foot. 394 N Niangua Dr is a home located in Christian County with nearby schools including Century Elementary School, Summit Intermediate School, and Nixa Junior High School.
Ownership History
Date
Name
Owned For
Owner Type
Purchase Details
Closed on
Jun 29, 2009
Sold by
Burk Ronald and Burk Leslie
Bought by
Gray Judy and Davidson Robert
Current Estimated Value
Home Financials for this Owner
Home Financials are based on the most recent Mortgage that was taken out on this home.
Original Mortgage
$172,975
Outstanding Balance
$109,052
Interest Rate
4.97%
Mortgage Type
FHA
Estimated Equity
$337,242
Create a Home Valuation Report for This Property
The Home Valuation Report is an in-depth analysis detailing your home's value as well as a comparison with similar homes in the area
Home Values in the Area
Average Home Value in this Area
Purchase History
We collect this data history from publicly available records. To have your information removed, we recommend requesting removal directly through your county’s website.
| Date | Buyer | Sale Price | Title Company |
|---|---|---|---|
| Gray Judy | -- | Choice Escrow & Land Title L |
Source: Public Records
Mortgage History
We collect this data history from publicly available records. To have your information removed, we recommend requesting removal directly through your county’s website.
| Date | Status | Borrower | Loan Amount |
|---|---|---|---|
| Open | Gray Judy | $172,975 |
Source: Public Records
Tax History
| Year | Tax Paid | Tax Assessment Tax Assessment Total Assessment is a certain percentage of the fair market value that is determined by local assessors to be the total taxable value of land and additions on the property. | Land | Improvement |
|---|---|---|---|---|
| 2025 | $2,865 | $49,080 | -- | -- |
| 2024 | $2,865 | $45,980 | -- | -- |
| 2023 | $2,865 | $45,980 | $0 | $0 |
| 2022 | $2,486 | $39,840 | $0 | $0 |
| 2021 | $2,487 | $39,840 | $0 | $0 |
| 2020 | $2,095 | $32,030 | $0 | $0 |
| 2019 | $2,095 | $32,030 | $0 | $0 |
| 2018 | $1,952 | $32,030 | $0 | $0 |
| 2017 | $1,952 | $32,030 | $0 | $0 |
| 2016 | $1,922 | $32,030 | $0 | $0 |
| 2015 | $1,924 | $32,030 | $32,030 | $0 |
| 2014 | $1,883 | $32,130 | $0 | $0 |
| 2013 | $1,886 | $32,130 | $0 | $0 |
Source: Public Records
Map
Nearby Homes
- 602 Cherry St
- 316 Hillcrest Ave
- 640 E Spring Valley Cir Unit 1
- 602 Oak Leaf Ct
- 607 E Mount Vernon St
- 603 E Mount Vernon St
- 111 N Majestic Oak Dr
- 701 Hillcrest Ave
- 985 Crimson Ave
- 627 N Rockingham Ave
- 301 Poplar St
- 104 Missouri Ave
- 721 Bluegill St
- 416 N Prospect St
- 855 E Ashford Ave
- 634 N Rockingham Ave
- 209&211 E Mount Vernon St
- 204 N Blarney Ct
- 202 N Blarney Ct
- 518 N Dublin Dr
- 392 N Niangua Dr
- 396 N Niangua Dr
- 722 Meramec Ln
- 711 E Piney Ridge
- 390 N Niangua Dr
- 720 E Meramec Ln
- 398 N Niangua Dr
- 724 Meramec Ln
- 710 E Piney Ridge
- 718 E Meramec Ln
- 710 E Niangua Dr
- 709 E Piney Ridge
- 709 E Niangua Dr
- 708 E Piney Ridge
- 716 Meramec Ln
- 723 E Meramec Ln
- 723 Meramec Ln
- 389 N Niangua Dr
- 708 E Niangua Dr
- 726 Meramec Ln
Your Personal Tour Guide
Ask me questions while you tour the home.