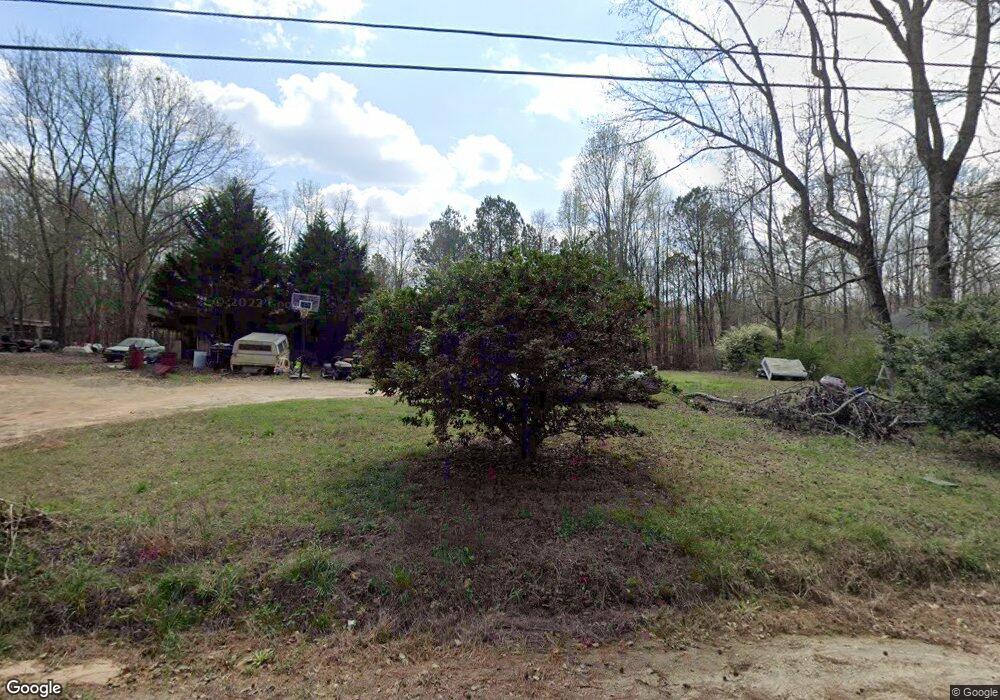
394 Patterson Rd Franklin, GA 30217
Estimated Value: $149,000 - $265,000
3
Beds
2
Baths
1,680
Sq Ft
$127/Sq Ft
Est. Value
About This Home
This home is located at 394 Patterson Rd, Franklin, GA 30217 and is currently estimated at $213,870, approximately $127 per square foot. 394 Patterson Rd is a home located in Heard County with nearby schools including Heard County High School.
Ownership History
Date
Name
Owned For
Owner Type
Purchase Details
Closed on
Aug 4, 2020
Sold by
Kitchens Tyron
Bought by
Yearta Bonnie
Current Estimated Value
Purchase Details
Closed on
Feb 14, 2007
Sold by
Not Provided
Bought by
Yearta Bonnie
Purchase Details
Closed on
Oct 3, 2006
Sold by
Citimortgage Inc
Bought by
Citimortgage Inc
Purchase Details
Closed on
Nov 26, 2003
Sold by
Gable Anthony and Gable Jane
Bought by
Brand Robert and Brand Holly
Purchase Details
Closed on
Feb 12, 1998
Sold by
Associates Financial
Bought by
Gable Anthony and Gable Jane
Purchase Details
Closed on
Jun 4, 1997
Sold by
Britt Joseph Edward
Bought by
Associates Financial
Purchase Details
Closed on
Dec 28, 1995
Sold by
Richards Homes Inc
Bought by
Britt Joseph Edward
Purchase Details
Closed on
Dec 12, 1995
Sold by
Journey Joseph V
Bought by
Richards Homes Inc
Purchase Details
Closed on
Jul 9, 1994
Sold by
Brown Jack P & Co
Bought by
Journey Joseph V
Create a Home Valuation Report for This Property
The Home Valuation Report is an in-depth analysis detailing your home's value as well as a comparison with similar homes in the area
Home Values in the Area
Average Home Value in this Area
Purchase History
| Date | Buyer | Sale Price | Title Company |
|---|---|---|---|
| Yearta Bonnie | -- | -- | |
| Yearta Bonnie | $58,000 | -- | |
| Citimortgage Inc | $41,493 | -- | |
| Brand Robert | -- | -- | |
| Gable Anthony | $53,000 | -- | |
| Associates Financial | -- | -- | |
| Britt Joseph Edward | -- | -- | |
| Richards Homes Inc | -- | -- | |
| Journey Joseph V | $4,500 | -- |
Source: Public Records
Tax History Compared to Growth
Tax History
| Year | Tax Paid | Tax Assessment Tax Assessment Total Assessment is a certain percentage of the fair market value that is determined by local assessors to be the total taxable value of land and additions on the property. | Land | Improvement |
|---|---|---|---|---|
| 2024 | $910 | $45,116 | $3,400 | $41,716 |
| 2023 | $852 | $40,798 | $2,833 | $37,965 |
| 2022 | $725 | $34,756 | $1,758 | $32,998 |
| 2021 | $620 | $28,237 | $1,758 | $26,479 |
| 2020 | $623 | $28,064 | $1,758 | $26,306 |
| 2019 | $623 | $28,064 | $1,758 | $26,306 |
| 2018 | $635 | $28,064 | $1,758 | $26,306 |
| 2017 | $601 | $26,611 | $1,564 | $25,047 |
| 2016 | $601 | $26,611 | $1,564 | $25,047 |
| 2015 | -- | $32,406 | $2,904 | $29,503 |
| 2014 | -- | $32,410 | $2,904 | $29,507 |
| 2013 | -- | $36,863 | $2,903 | $33,960 |
Source: Public Records
Map
Nearby Homes
- 11520 US Highway 27
- 12439 U S 27
- 18 Rivers Edge Ln Unit LOT 5
- 22 Rivers Edge Ln Unit LOT 7
- 12 Rivers Edge Ln Unit LOT 2
- 24 Rivers Edge Ln Unit LOT 8
- 20 Rivers Edge Ln Unit LOT 6
- 27 Rivers Edge Ln Unit LOT 9
- 25 Rivers Edge Ln Unit LOT 10
- 14 Rivers Edge Ln Unit LOT 3
- 10 Rivers Edge Ln Unit LOT 1
- 21 Rivers Edge Ln Unit LOT 12
- 23 Rivers Edge Ln Unit LOT 11
- 125 Patterson Dr
- 155 Patterson Dr
- 25 Patterson Dr
- 105 Patterson Dr
- The Lambert Plan at Patterson Park
- The Bradford Plan at Patterson Park
- The Millie Plan at Patterson Park
- 364 Patterson Rd
- 1033 Five Notch Rd
- 422 Patterson Rd
- 927 Five Notch Rd
- 0 Patterson Rd
- 0 Patterson Rd Unit 8340649
- 272 Patterson Rd
- 1135 Five Notch Rd
- 1094 Five Notch Rd
- 1144 Five Notch Rd
- 323 Patterson Rd
- 930 Five Notch Rd
- 211 Patterson Rd
- 221 Patterson Rd
- 1259 Five Notch Rd
- 733 Five Notch Rd
- 691 Five Notch Rd
- 160 Patterson Rd
- 87 Norwood Cir
- 1150 Five Notch Rd