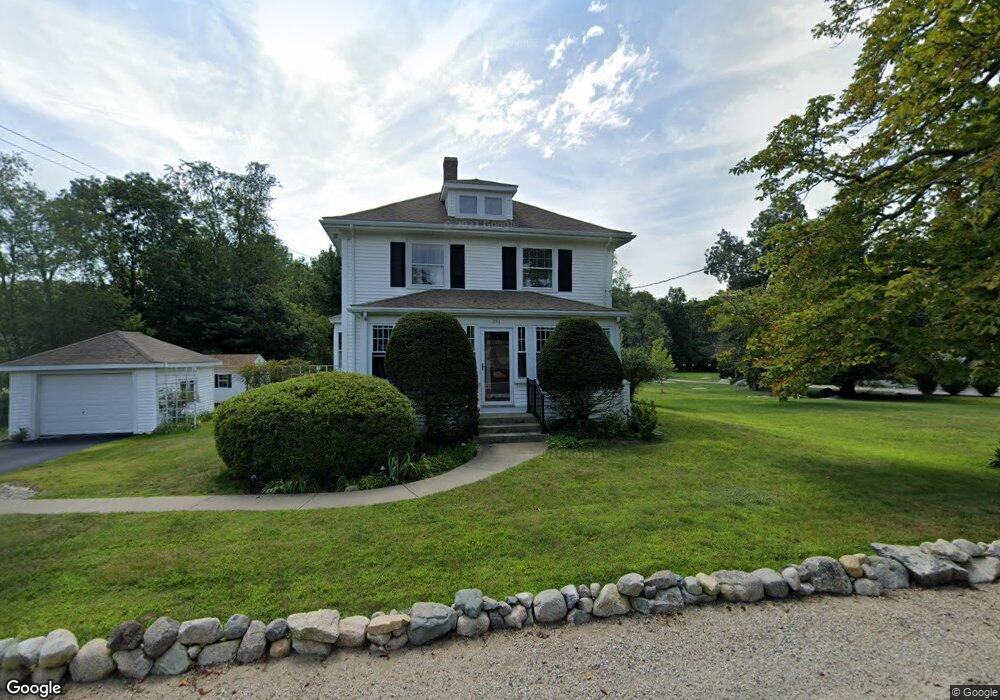
394 Rockland St Abington, MA 02351
Estimated Value: $593,000 - $665,000
4
Beds
3
Baths
1,595
Sq Ft
$389/Sq Ft
Est. Value
About This Home
This home is located at 394 Rockland St, Abington, MA 02351 and is currently estimated at $620,731, approximately $389 per square foot. 394 Rockland St is a home located in Plymouth County with nearby schools including Beaver Brook Elementary School, Woodsdale School, and Abington Middle School.
Ownership History
Date
Name
Owned For
Owner Type
Purchase Details
Closed on
May 28, 2019
Sold by
Ross Allan G and Ross Kathleen M
Bought by
Ross Irt
Current Estimated Value
Purchase Details
Closed on
May 1, 1987
Sold by
Reckhow Steven W
Bought by
Ross Allan G
Create a Home Valuation Report for This Property
The Home Valuation Report is an in-depth analysis detailing your home's value as well as a comparison with similar homes in the area
Home Values in the Area
Average Home Value in this Area
Purchase History
| Date | Buyer | Sale Price | Title Company |
|---|---|---|---|
| Ross Irt | -- | -- | |
| Ross Allan G | $174,000 | -- |
Source: Public Records
Mortgage History
| Date | Status | Borrower | Loan Amount |
|---|---|---|---|
| Previous Owner | Ross Allan G | $121,000 | |
| Previous Owner | Ross Allan G | $123,000 | |
| Previous Owner | Ross Allan G | $100,000 | |
| Previous Owner | Ross Allan G | $85,500 |
Source: Public Records
Tax History Compared to Growth
Tax History
| Year | Tax Paid | Tax Assessment Tax Assessment Total Assessment is a certain percentage of the fair market value that is determined by local assessors to be the total taxable value of land and additions on the property. | Land | Improvement |
|---|---|---|---|---|
| 2025 | $6,789 | $519,800 | $251,300 | $268,500 |
| 2024 | $6,563 | $490,500 | $229,600 | $260,900 |
| 2023 | $6,157 | $433,300 | $201,200 | $232,100 |
| 2022 | $6,120 | $402,100 | $177,600 | $224,500 |
| 2021 | $5,672 | $344,200 | $162,200 | $182,000 |
| 2020 | $5,695 | $335,000 | $157,600 | $177,400 |
| 2019 | $6,686 | $315,500 | $150,700 | $164,800 |
| 2018 | $5,300 | $297,400 | $150,700 | $146,700 |
| 2017 | $5,730 | $286,400 | $150,700 | $135,700 |
| 2016 | $4,974 | $277,400 | $144,100 | $133,300 |
| 2015 | $4,750 | $279,400 | $144,100 | $135,300 |
Source: Public Records
Map
Nearby Homes
- 257 Rockland St Unit 257
- 164 Hancock St
- 9 Karen Ln
- 209 Hancock St
- 79 Groveland St
- 715 Thayer St Unit 715
- 37 Rockland St
- 34 George h Gillespie Way
- 101 Highfields Rd
- 197 Bedford St
- 10 Bank St
- 40 Bedford St
- 295 Ashland St
- 10 Mccue Cir
- 287 High St
- 521 Washington St Unit 1
- 23 Loganberry Dr
- 135 Bank St
- 87 Summer St
- 451 Lincoln St
- 00 Hancock St
- 8 Hancock St
- 408 Rockland St
- 399 Rockland St
- 366 Rockland St
- 383 Rockland St
- 426 Rockland St
- 28 Hancock St
- 27 Hancock St
- 367 Rockland St
- 367 Rockland St Unit 1
- 367 Rockland St Unit 2
- 356 Rockland St
- 6 Pusateri Place
- 3 Pusateri Place
- 438 Rockland St
- 431 Rockland St
- 7 Caitlin Dr
- 38 Hancock St
- 339 Rockland St