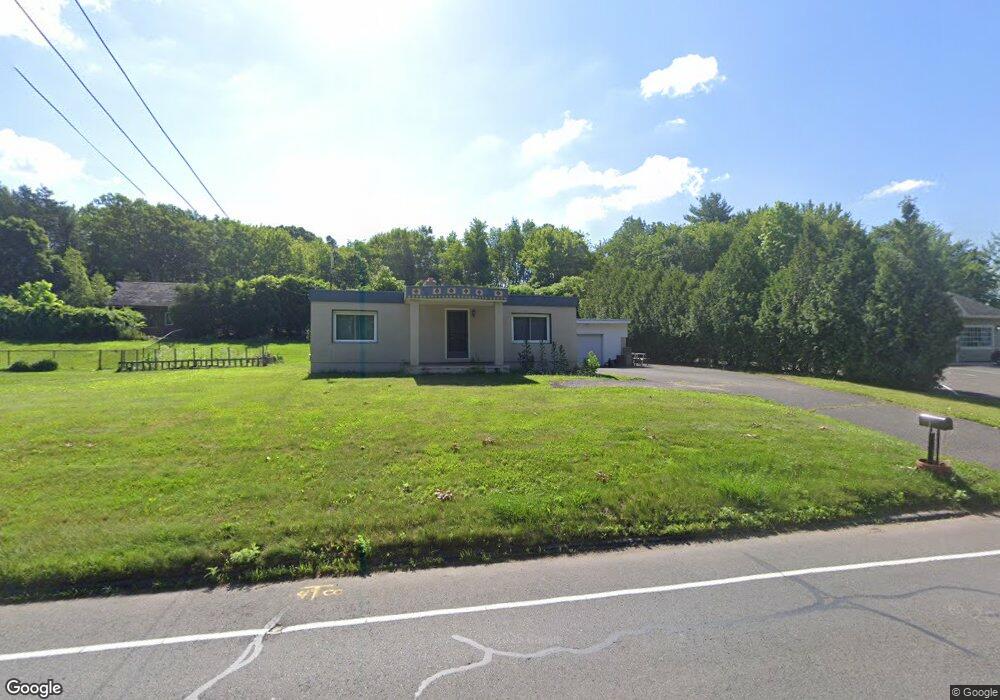
394 West St Ludlow, MA 01056
Estimated Value: $198,000 - $325,000
2
Beds
2
Baths
1,320
Sq Ft
$204/Sq Ft
Est. Value
About This Home
This home is located at 394 West St, Ludlow, MA 01056 and is currently estimated at $268,692, approximately $203 per square foot. 394 West St is a home located in Hampden County with nearby schools including East Street Elementary School, Chapin Street Elementary School, and Paul R. Baird Middle School.
Ownership History
Date
Name
Owned For
Owner Type
Purchase Details
Closed on
Dec 3, 2004
Sold by
Bradway Cora C and Thompson James V
Bought by
Wales Kevin
Current Estimated Value
Home Financials for this Owner
Home Financials are based on the most recent Mortgage that was taken out on this home.
Original Mortgage
$111,453
Outstanding Balance
$54,901
Interest Rate
5.69%
Mortgage Type
Purchase Money Mortgage
Estimated Equity
$213,791
Purchase Details
Closed on
Nov 9, 2004
Sold by
Bradway Cora C and Thompson James V
Bought by
Belanger David G and Belanger Myong O
Home Financials for this Owner
Home Financials are based on the most recent Mortgage that was taken out on this home.
Original Mortgage
$111,453
Outstanding Balance
$54,901
Interest Rate
5.69%
Mortgage Type
Purchase Money Mortgage
Estimated Equity
$213,791
Create a Home Valuation Report for This Property
The Home Valuation Report is an in-depth analysis detailing your home's value as well as a comparison with similar homes in the area
Home Values in the Area
Average Home Value in this Area
Purchase History
| Date | Buyer | Sale Price | Title Company |
|---|---|---|---|
| Wales Kevin | $114,900 | -- | |
| Wales Kevin | $114,900 | -- | |
| Belanger David G | $92,500 | -- | |
| Belanger David G | $92,500 | -- |
Source: Public Records
Mortgage History
| Date | Status | Borrower | Loan Amount |
|---|---|---|---|
| Open | Wales Kevin | $111,453 | |
| Closed | Wales Kevin | $3,447 | |
| Closed | Belanger David G | $111,453 |
Source: Public Records
Tax History Compared to Growth
Tax History
| Year | Tax Paid | Tax Assessment Tax Assessment Total Assessment is a certain percentage of the fair market value that is determined by local assessors to be the total taxable value of land and additions on the property. | Land | Improvement |
|---|---|---|---|---|
| 2025 | $3,956 | $228,000 | $64,400 | $163,600 |
| 2024 | $3,765 | $208,100 | $64,300 | $143,800 |
| 2023 | $3,498 | $179,300 | $53,500 | $125,800 |
| 2022 | $3,310 | $165,600 | $53,500 | $112,100 |
| 2021 | $3,307 | $156,900 | $53,500 | $103,400 |
| 2020 | $3,167 | $153,600 | $52,700 | $100,900 |
| 2019 | $2,951 | $148,900 | $52,200 | $96,700 |
| 2018 | $2,760 | $145,200 | $52,200 | $93,000 |
| 2017 | $2,715 | $146,500 | $53,100 | $93,400 |
| 2016 | $2,551 | $140,700 | $52,100 | $88,600 |
Source: Public Records
Map
Nearby Homes
- 350 West St Unit 19
- 482 Holyoke St
- 319 West St
- 436 Holyoke St
- 41 Deroche Cir
- 251 West St
- 166 Kendall St
- 61 Massachusetts Ave
- 3 Fontaine St
- 42 Roy St
- 1133 Burnett Rd
- 1130 Burnett Rd
- 33 Grimard St
- 0 Nash Hill Rd
- 58 Mariana Ln
- '0' Rood St
- 98 Fuller St Unit 32
- 84 Fuller St Unit 1
- 60 Loopley St
- 42 Loopley St