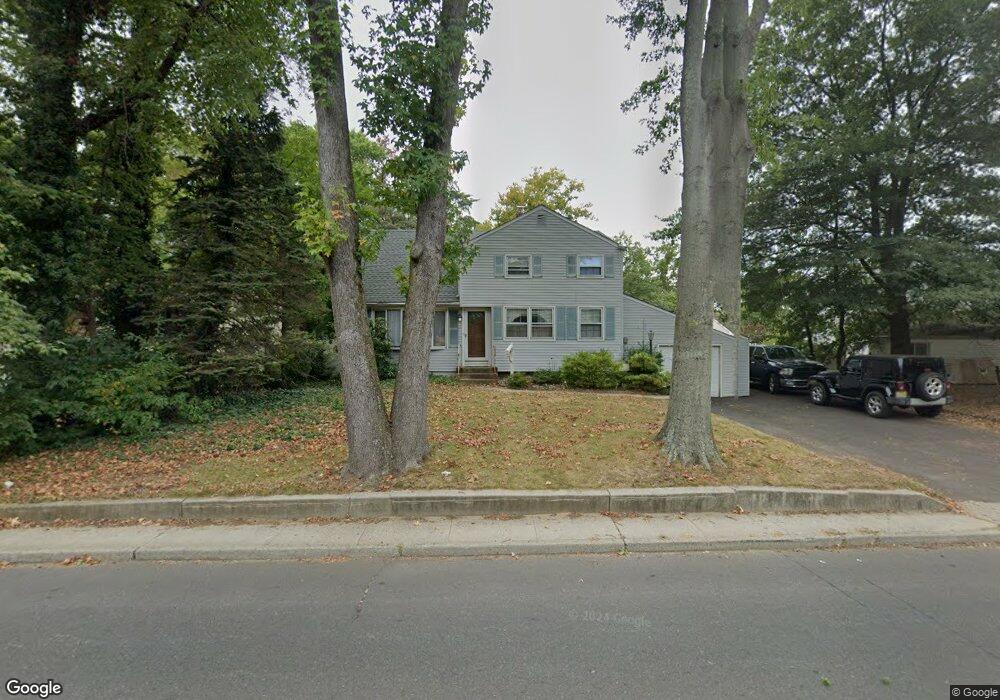
394 Wilson Ave Middletown, NJ 07748
New Monmouth NeighborhoodEstimated Value: $611,020 - $669,000
3
Beds
2
Baths
1,500
Sq Ft
$419/Sq Ft
Est. Value
About This Home
This home is located at 394 Wilson Ave, Middletown, NJ 07748 and is currently estimated at $627,755, approximately $418 per square foot. 394 Wilson Ave is a home located in Monmouth County with nearby schools including New Monmouth Elementary School, Thorne Middle School, and Middletown High School North.
Ownership History
Date
Name
Owned For
Owner Type
Purchase Details
Closed on
Nov 16, 2010
Sold by
Quinn John Patrick and Quinn Alice Marie
Bought by
Nolen John E and Nolen Tracy A
Current Estimated Value
Home Financials for this Owner
Home Financials are based on the most recent Mortgage that was taken out on this home.
Original Mortgage
$306,450
Outstanding Balance
$201,985
Interest Rate
4.25%
Mortgage Type
Stand Alone First
Estimated Equity
$425,770
Create a Home Valuation Report for This Property
The Home Valuation Report is an in-depth analysis detailing your home's value as well as a comparison with similar homes in the area
Home Values in the Area
Average Home Value in this Area
Purchase History
| Date | Buyer | Sale Price | Title Company |
|---|---|---|---|
| Nolen John E | $307,000 | First American Title Ins Co |
Source: Public Records
Mortgage History
| Date | Status | Borrower | Loan Amount |
|---|---|---|---|
| Open | Nolen John E | $306,450 |
Source: Public Records
Tax History Compared to Growth
Tax History
| Year | Tax Paid | Tax Assessment Tax Assessment Total Assessment is a certain percentage of the fair market value that is determined by local assessors to be the total taxable value of land and additions on the property. | Land | Improvement |
|---|---|---|---|---|
| 2025 | $7,748 | $507,200 | $335,800 | $171,400 |
| 2024 | $7,286 | $471,000 | $302,800 | $168,200 |
| 2023 | $7,286 | $419,200 | $292,100 | $127,100 |
| 2022 | $6,920 | $353,700 | $232,700 | $121,000 |
| 2021 | $6,920 | $332,700 | $216,900 | $115,800 |
| 2020 | $6,916 | $323,500 | $210,400 | $113,100 |
| 2019 | $6,820 | $322,900 | $210,400 | $112,500 |
| 2018 | $6,393 | $295,000 | $187,700 | $107,300 |
| 2017 | $6,433 | $293,900 | $189,900 | $104,000 |
| 2016 | $5,937 | $278,600 | $176,400 | $102,200 |
| 2015 | $6,149 | $278,600 | $176,400 | $102,200 |
| 2014 | $5,701 | $251,900 | $149,400 | $102,500 |
Source: Public Records
Map
Nearby Homes