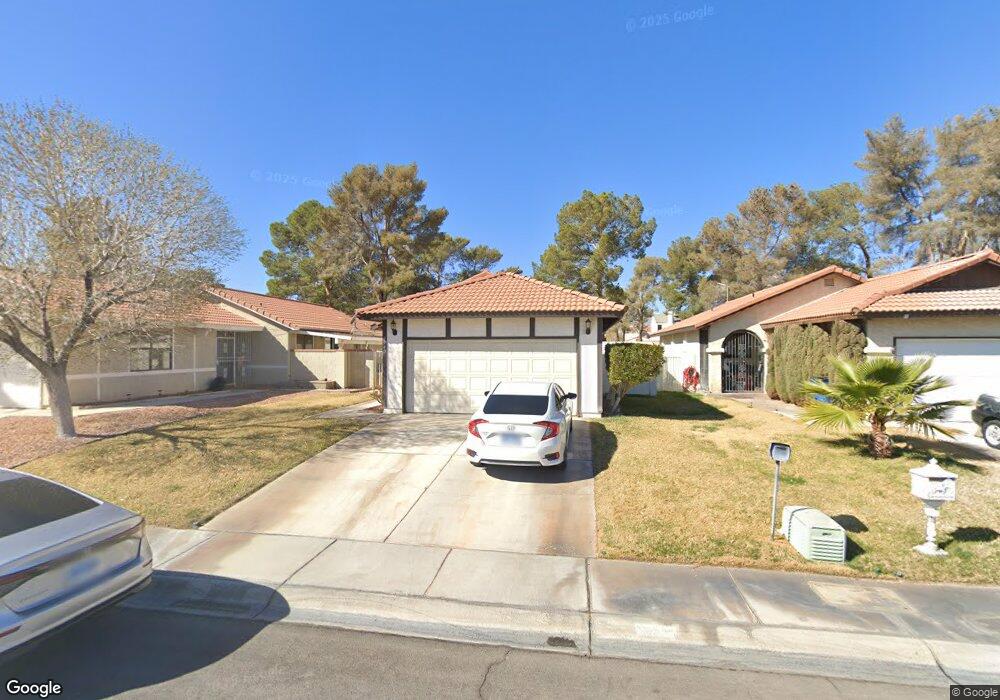
3940 Applecrest St Unit 1 Las Vegas, NV 89108
Woodcrest NeighborhoodEstimated Value: $341,033 - $368,000
2
Beds
2
Baths
1,184
Sq Ft
$302/Sq Ft
Est. Value
About This Home
This home is located at 3940 Applecrest St Unit 1, Las Vegas, NV 89108 and is currently estimated at $357,008, approximately $301 per square foot. 3940 Applecrest St Unit 1 is a home located in Clark County with nearby schools including R.E. Tobler Elementary School, Irwin & Susan Molasky Junior High School, and Cheyenne High School.
Ownership History
Date
Name
Owned For
Owner Type
Purchase Details
Closed on
Apr 22, 2005
Sold by
Grahlman Bill
Bought by
Grahlman Bill
Current Estimated Value
Home Financials for this Owner
Home Financials are based on the most recent Mortgage that was taken out on this home.
Original Mortgage
$120,854
Outstanding Balance
$62,932
Interest Rate
5.92%
Mortgage Type
FHA
Estimated Equity
$294,076
Purchase Details
Closed on
Aug 28, 2002
Sold by
Grahlman Dawn R
Bought by
Grahlman Bill
Home Financials for this Owner
Home Financials are based on the most recent Mortgage that was taken out on this home.
Original Mortgage
$122,576
Interest Rate
6.43%
Mortgage Type
FHA
Purchase Details
Closed on
Aug 21, 2002
Sold by
Greene Gayle S
Bought by
Grahlman Bill
Home Financials for this Owner
Home Financials are based on the most recent Mortgage that was taken out on this home.
Original Mortgage
$122,576
Interest Rate
6.43%
Mortgage Type
FHA
Create a Home Valuation Report for This Property
The Home Valuation Report is an in-depth analysis detailing your home's value as well as a comparison with similar homes in the area
Home Values in the Area
Average Home Value in this Area
Purchase History
| Date | Buyer | Sale Price | Title Company |
|---|---|---|---|
| Grahlman Bill | -- | Lawyers Title Of Nevada | |
| Grahlman Bill | -- | United Title | |
| Grahlman Bill | $124,500 | United Title |
Source: Public Records
Mortgage History
| Date | Status | Borrower | Loan Amount |
|---|---|---|---|
| Open | Grahlman Bill | $120,854 | |
| Closed | Grahlman Bill | $122,576 |
Source: Public Records
Tax History Compared to Growth
Tax History
| Year | Tax Paid | Tax Assessment Tax Assessment Total Assessment is a certain percentage of the fair market value that is determined by local assessors to be the total taxable value of land and additions on the property. | Land | Improvement |
|---|---|---|---|---|
| 2025 | $971 | $56,334 | $27,300 | $29,034 |
| 2024 | $943 | $56,334 | $27,300 | $29,034 |
| 2023 | $943 | $58,570 | $30,100 | $28,470 |
| 2022 | $916 | $50,115 | $23,800 | $26,315 |
| 2021 | $889 | $46,414 | $21,000 | $25,414 |
| 2020 | $860 | $45,868 | $20,300 | $25,568 |
| 2019 | $835 | $41,928 | $16,450 | $25,478 |
| 2018 | $811 | $39,508 | $14,700 | $24,808 |
| 2017 | $1,256 | $38,301 | $12,950 | $25,351 |
| 2016 | $769 | $35,071 | $9,100 | $25,971 |
| 2015 | $766 | $30,218 | $6,930 | $23,288 |
| 2014 | $744 | $22,019 | $5,775 | $16,244 |
Source: Public Records
Map
Nearby Homes
- 3948 Applecrest St
- 3936 Applecrest St Unit 1
- 3929 Dream St
- 6465 Plumcrest Rd
- 4012 Mira Ln
- 6556 Gatehouse Ln
- 6429 Roy Rogers Dr Unit 2
- 6604 Gatehouse Ln
- 3805 Twig Ln
- 6645 Telegraph Rd
- 6609 Joe Michael Way
- 6660 Joe Michael Way
- 4113 Compass Rose Way
- 3757 N Torrey Pines Dr
- 4217 Jasper Ave
- 4229 Jadestone Ave
- 3745 Colfax Cir
- 4232 Orangeblossom Ct
- 6440 Marrow Rd
- 3737 Broadriver Dr
- 3944 Applecrest St
- 3932 Applecrest St
- 3948 Applecrest St
- 3948 Applecrest St Unit n/a
- 3928 Applecrest St Unit 1
- 6517 Pearcrest Rd
- 6528 Pearcrest Rd
- 3924 Applecrest St
- 3924 Applecrest St
- 3937 Applecrest St
- 6513 Pearcrest Rd
- 6513 Pearcrest Rd Unit house
- 6513 Pearcrest Rd Unit SFR
- 6513 Pearcrest Rd Unit home
- 6524 Pearcrest Rd
- 3933 Applecrest St
- 6520 Pearcrest Rd Unit 1
- 6509 Pearcrest Rd
- 3929 Applecrest St
- 6516 Pearcrest Rd Unit 1