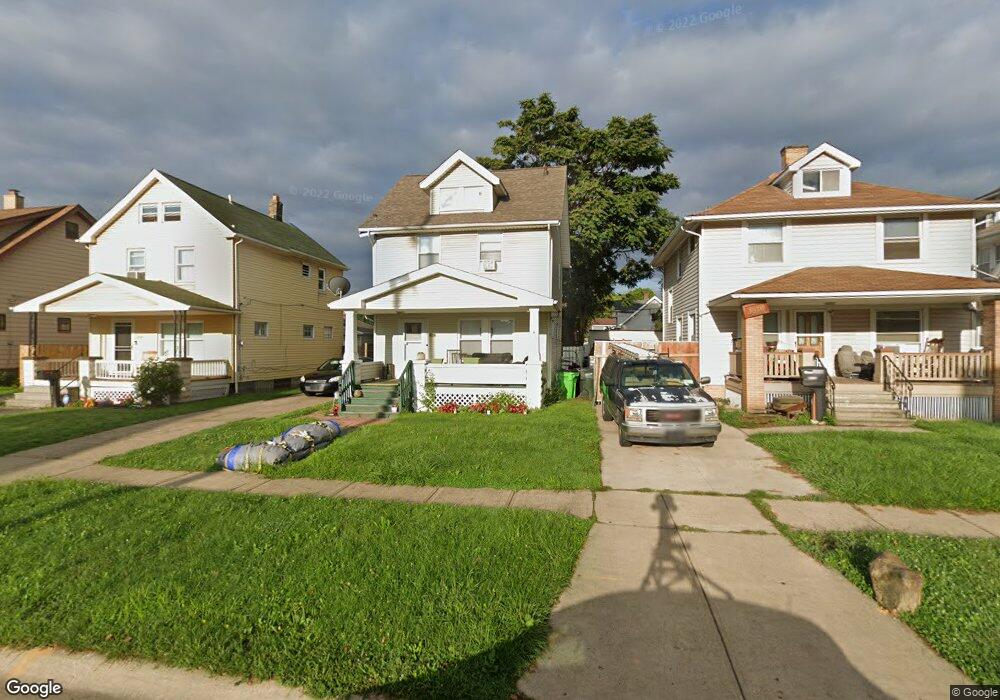
3940 E 42nd St Newburgh Heights, OH 44105
Estimated Value: $117,000 - $150,000
3
Beds
1
Bath
1,080
Sq Ft
$121/Sq Ft
Est. Value
About This Home
This home is located at 3940 E 42nd St, Newburgh Heights, OH 44105 and is currently estimated at $131,079, approximately $121 per square foot. 3940 E 42nd St is a home located in Cuyahoga County with nearby schools including Anton Grdina School, Benjamin Franklin, and Bolton.
Ownership History
Date
Name
Owned For
Owner Type
Purchase Details
Closed on
Oct 30, 2023
Sold by
A Nd M Properties Llc
Bought by
Sm Marketing Services Llc
Current Estimated Value
Purchase Details
Closed on
Jan 24, 2019
Sold by
Younger Muhammad and Brown Charlene
Bought by
A And M Properties Llc
Purchase Details
Closed on
Jun 21, 2018
Sold by
Mr Inc
Bought by
Younger Muhammad W and Brown Charlene C
Purchase Details
Closed on
Nov 28, 2016
Sold by
Mr Inc
Bought by
Younger Muhamand W and Broewn Charlene C
Purchase Details
Closed on
Aug 9, 1989
Sold by
Rome0 James M
Bought by
M R Inc A Corporation
Purchase Details
Closed on
Feb 2, 1988
Sold by
Romeo James M
Bought by
Rome0 James M
Purchase Details
Closed on
Feb 28, 1986
Sold by
Pokorny Albert J
Bought by
Romeo James M
Purchase Details
Closed on
Jan 1, 1975
Bought by
Pokorny Albert J
Create a Home Valuation Report for This Property
The Home Valuation Report is an in-depth analysis detailing your home's value as well as a comparison with similar homes in the area
Home Values in the Area
Average Home Value in this Area
Purchase History
| Date | Buyer | Sale Price | Title Company |
|---|---|---|---|
| Sm Marketing Services Llc | -- | None Listed On Document | |
| A And M Properties Llc | $23,900 | None Available | |
| Younger Muhammad W | $42,000 | None Available | |
| Younger Muhamand W | -- | None Available | |
| M R Inc A Corporation | $25,400 | -- | |
| Rome0 James M | $2,400 | -- | |
| Romeo James M | $29,300 | -- | |
| Pokorny Albert J | -- | -- |
Source: Public Records
Mortgage History
| Date | Status | Borrower | Loan Amount |
|---|---|---|---|
| Closed | Younger Muhamand W | $0 |
Source: Public Records
Tax History Compared to Growth
Tax History
| Year | Tax Paid | Tax Assessment Tax Assessment Total Assessment is a certain percentage of the fair market value that is determined by local assessors to be the total taxable value of land and additions on the property. | Land | Improvement |
|---|---|---|---|---|
| 2024 | $2,634 | $32,900 | $6,720 | $26,180 |
| 2023 | $1,598 | $14,700 | $3,360 | $11,340 |
| 2022 | $1,595 | $14,700 | $3,360 | $11,340 |
| 2021 | $1,584 | $14,700 | $3,360 | $11,340 |
| 2020 | $2,001 | $16,730 | $3,220 | $13,510 |
| 2019 | $1,892 | $47,800 | $9,200 | $38,600 |
| 2018 | $1,988 | $16,730 | $3,220 | $13,510 |
| 2017 | $2,128 | $19,080 | $3,150 | $15,930 |
| 2016 | $2,116 | $19,080 | $3,150 | $15,930 |
| 2015 | $2,257 | $19,080 | $3,150 | $15,930 |
| 2014 | $2,257 | $20,720 | $3,430 | $17,290 |
Source: Public Records
Map
Nearby Homes
- 3896 E 43rd St
- 4612 Mcgregor Ave
- 4011 E 29th St
- 4609 Pearse Ave
- 4026 E 52nd St
- 3831 E 50th St
- 3930 E 53rd St
- 3628 Beyerle Rd
- 4031 E 53rd St
- 4014 E 54th St
- 3616 Independence Rd
- 3716 E 50th St
- 3721 E 50th St
- 5413 Brow Ave
- 3722 E 52nd St
- 5416 Orey Ave
- 3569 Independence Rd
- 3819 E 54th St
- 3893 E 55th St
- 3799 E 54th St