Estimated Value: $277,620 - $382,000
--
Bed
3
Baths
2,262
Sq Ft
$146/Sq Ft
Est. Value
About This Home
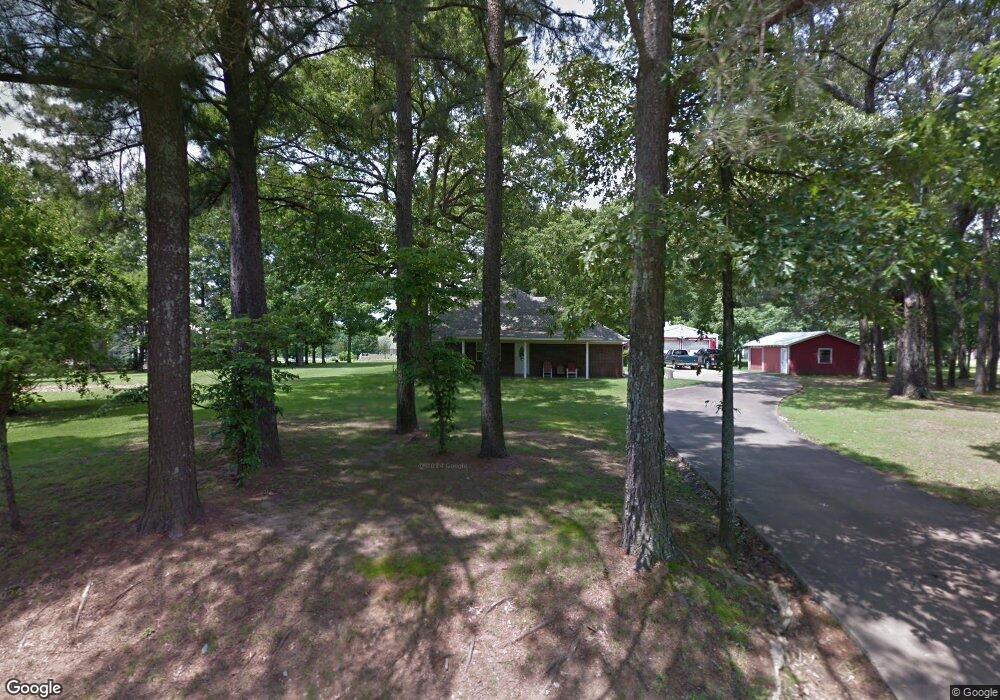
This home is located at 3940 Kerr Station Rd, Cabot, AR 72023 and is currently estimated at $329,405, approximately $145 per square foot. 3940 Kerr Station Rd is a home located in Lonoke County with nearby schools including Southside Elementary School, Cabot Junior High South, and Cabot Middle School South.
Ownership History
Date
Name
Owned For
Owner Type
Purchase Details
Closed on
Aug 18, 2004
Bought by
Fair and Fair Wf
Current Estimated Value
Purchase Details
Closed on
Aug 10, 2004
Bought by
Fair and Fair Wf
Purchase Details
Closed on
Jul 8, 2002
Bought by
Evans and Evans Wf
Purchase Details
Closed on
Apr 30, 2002
Bought by
Staggs and Staggs Wf
Purchase Details
Closed on
Dec 5, 2001
Bought by
Owens and Owens Wf
Purchase Details
Closed on
Jan 18, 2001
Bought by
Evans and Evans Wf
Purchase Details
Closed on
Dec 29, 2000
Bought by
Garnett'S
Purchase Details
Closed on
Mar 17, 2000
Bought by
Morris 22 Ac
Purchase Details
Closed on
Jan 14, 1987
Bought by
Joe & Karen Trustees
Purchase Details
Closed on
Dec 29, 1982
Bought by
Joe and Joe Karen
Create a Home Valuation Report for This Property
The Home Valuation Report is an in-depth analysis detailing your home's value as well as a comparison with similar homes in the area
Home Values in the Area
Average Home Value in this Area
Purchase History
| Date | Buyer | Sale Price | Title Company |
|---|---|---|---|
| Fair | $72,000 | -- | |
| Fair | $72,000 | -- | |
| Evans | $55,000 | -- | |
| Staggs | $28,000 | -- | |
| Englehart | $38,000 | -- | |
| Owens | -- | -- | |
| Evans | $45,000 | -- | |
| Theirselves As Trustee Garnett | -- | -- | |
| Declaration Of Trust Joe & Kar | -- | -- | |
| Garnett'S | -- | -- | |
| Morris 22 Ac | $138,000 | -- | |
| Garnett Reliving Lf Estate | -- | -- | |
| Joe & Karen Trustees | -- | -- | |
| Joe | -- | -- |
Source: Public Records
Tax History Compared to Growth
Tax History
| Year | Tax Paid | Tax Assessment Tax Assessment Total Assessment is a certain percentage of the fair market value that is determined by local assessors to be the total taxable value of land and additions on the property. | Land | Improvement |
|---|---|---|---|---|
| 2025 | $1,145 | $39,420 | $3,160 | $36,260 |
| 2024 | $1,145 | $39,420 | $3,160 | $36,260 |
| 2023 | $1,145 | $39,420 | $3,160 | $36,260 |
| 2022 | $1,195 | $39,420 | $3,160 | $36,260 |
| 2021 | $1,195 | $39,420 | $3,160 | $36,260 |
| 2020 | $1,195 | $34,200 | $2,370 | $31,830 |
| 2019 | $1,195 | $34,200 | $2,370 | $31,830 |
| 2018 | $1,220 | $34,200 | $2,370 | $31,830 |
| 2017 | $1,450 | $34,200 | $2,370 | $31,830 |
| 2016 | $1,220 | $34,200 | $2,370 | $31,830 |
| 2015 | $1,397 | $32,940 | $2,370 | $30,570 |
| 2014 | $1,162 | $32,940 | $2,370 | $30,570 |
Source: Public Records
Map
Nearby Homes
- 84 Springwood Ct
- 118 N Candlewood
- 75 Chickadee Cove
- 21 Wolfsbridge Loop
- 19 Wolfsbridge Loop
- 17 Wolfsbridge Loop
- 15 Wolfsbridge Loop
- 97 Summerwood Dr
- 15 Calvados Ct
- 11 Calvados Ct
- 30 Ravell
- 0 Hwy 321 Odom Blvd (West Side) Unit 23036055
- 29 Mcclellan Dr
- 19 Aberdeen Dr
- 10 Bill Foster Memorial Hwy E
- 1 Bill Foster Memorial Hwy E
- 00 Bill Foster Memorial Hwy E
- 11 Brixton
- 29 Calvados Ct
- 28 Calvados Ct
- 3994 Kerr Station Rd
- 1264 Pickthorne Rd
- 3860 Kerr Station Rd
- 1292 Pickthorne Rd
- 1195 Pickthorne Rd
- 1050 Pickthorne Rd
- 1245 Pickthorne Rd
- 3760 Kerr Station Rd
- 3770 Kerr Station Rd
- 1374 Pickthorne Rd
- 3833 Kerr Station Rd
- 4074 Kerr Station Rd
- 1305 Pickthorne Rd
- 3780 Kerr Station Rd
- 3735 Kerr Station Rd
- 1003 Pickthorne Rd
- 4128 Kerr Station Rd
- 1375 Pickthorne Rd
- 985 Pickthorne Rd
- 1432 Pickthorne Rd