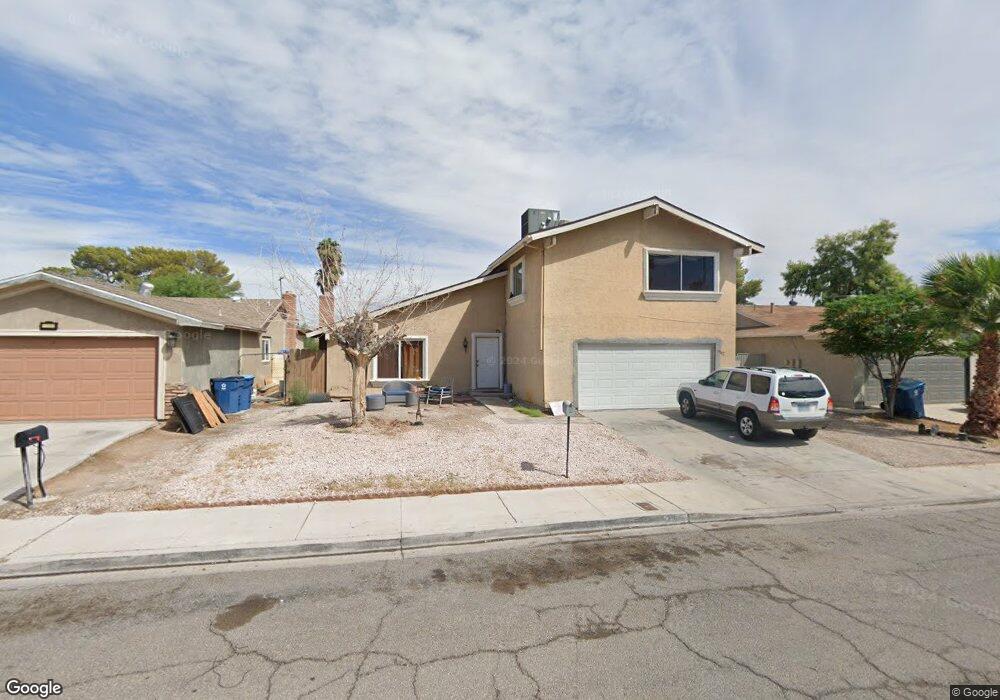
3942 Delling Ct Unit 5 Las Vegas, NV 89104
Estimated Value: $391,000 - $437,000
4
Beds
3
Baths
1,562
Sq Ft
$265/Sq Ft
Est. Value
About This Home
This home is located at 3942 Delling Ct Unit 5, Las Vegas, NV 89104 and is currently estimated at $413,832, approximately $264 per square foot. 3942 Delling Ct Unit 5 is a home located in Clark County with nearby schools including Walter V. Long Elementary School, Jerome Mack Middle School, and Desert Pines High School.
Ownership History
Date
Name
Owned For
Owner Type
Purchase Details
Closed on
Sep 8, 2021
Sold by
Flores Manuel
Bought by
Flores Joel Osorio and Osorio Noelia
Current Estimated Value
Purchase Details
Closed on
Mar 12, 2013
Sold by
Flores Manuel
Bought by
Flores Manuel and Flores Joel Osorio
Purchase Details
Closed on
Jul 18, 2011
Sold by
Copado Eva
Bought by
Flores Manuel
Purchase Details
Closed on
Jul 26, 2010
Sold by
Taylor Bean & Whitaker Mortgage Corp
Bought by
The Secretary Of Housing & Urban Develop
Purchase Details
Closed on
Jun 14, 2010
Sold by
Espino Fausto
Bought by
Taylor Bean & Whitaker Mortgage Corp
Purchase Details
Closed on
May 26, 2005
Sold by
Allen Maureen K
Bought by
Espino Fausto
Home Financials for this Owner
Home Financials are based on the most recent Mortgage that was taken out on this home.
Original Mortgage
$232,000
Interest Rate
6.45%
Mortgage Type
Unknown
Create a Home Valuation Report for This Property
The Home Valuation Report is an in-depth analysis detailing your home's value as well as a comparison with similar homes in the area
Home Values in the Area
Average Home Value in this Area
Purchase History
| Date | Buyer | Sale Price | Title Company |
|---|---|---|---|
| Flores Joel Osorio | -- | None Available | |
| Flores Manuel | $720,000 | None Available | |
| Flores Manuel | -- | Nevada Title Las Vegas | |
| Flores Manuel | $70,000 | Nevada Title Las Vegas | |
| The Secretary Of Housing & Urban Develop | $326,041 | Fidelity National Default S | |
| Taylor Bean & Whitaker Mortgage Corp | $326,041 | Accommodation | |
| Espino Fausto | $232,000 | National Title Company |
Source: Public Records
Mortgage History
| Date | Status | Borrower | Loan Amount |
|---|---|---|---|
| Previous Owner | Espino Fausto | $232,000 |
Source: Public Records
Tax History Compared to Growth
Tax History
| Year | Tax Paid | Tax Assessment Tax Assessment Total Assessment is a certain percentage of the fair market value that is determined by local assessors to be the total taxable value of land and additions on the property. | Land | Improvement |
|---|---|---|---|---|
| 2025 | $738 | $48,106 | $27,300 | $20,806 |
| 2024 | $717 | $48,106 | $27,300 | $20,806 |
| 2023 | $752 | $50,814 | $29,750 | $21,064 |
| 2022 | $730 | $44,311 | $24,500 | $19,811 |
| 2021 | $676 | $40,398 | $21,000 | $19,398 |
| 2020 | $653 | $40,405 | $20,650 | $19,755 |
| 2019 | $646 | $39,144 | $19,250 | $19,894 |
| 2018 | $616 | $35,192 | $15,750 | $19,442 |
| 2017 | $999 | $34,075 | $14,000 | $20,075 |
| 2016 | $585 | $31,172 | $10,150 | $21,022 |
| 2015 | $583 | $26,929 | $7,700 | $19,229 |
| 2014 | $565 | $21,245 | $5,600 | $15,645 |
Source: Public Records
Map
Nearby Homes
- 3887 Delling Ct
- 4057 Olive St
- 4067 E Colorado Ave
- 4055 E New York Ave
- 3724 Lanai Ave
- 1601 S Sandhill Rd Unit 78
- 1601 S Sandhill Rd Unit 191
- 1944 Randa Ln
- 1892 Miner Way
- 49 Del Amo Dr
- 45 Prince Ln
- 4217 Park Ct
- 4201 Essex Green Ct
- 4213 Essex Green Ct
- 89 Vallejo Ave
- 4280 Hampshire Green Ct
- 1147 May Ave
- 1624 Palm St Unit 159
- 1624 Palm St Unit 220
- 1624 Palm St Unit 237
- 3932 Delling Ct
- 3952 Delling Ct
- 3941 Olive St
- 3960 Delling Ct Unit 5
- 3924 Delling Ct
- 3951 Olive St
- 3931 Olive St
- 3943 Delling Ct
- 3959 Olive St
- 3933 Delling Ct
- 3921 Olive St
- 3953 Delling Ct
- 3914 Delling Ct
- 3970 Delling Ct
- 3925 Delling Ct
- 3959 Delling Ct
- 3969 Olive St
- 3911 Olive St
- 3904 Delling Ct
- 3969 Delling Ct