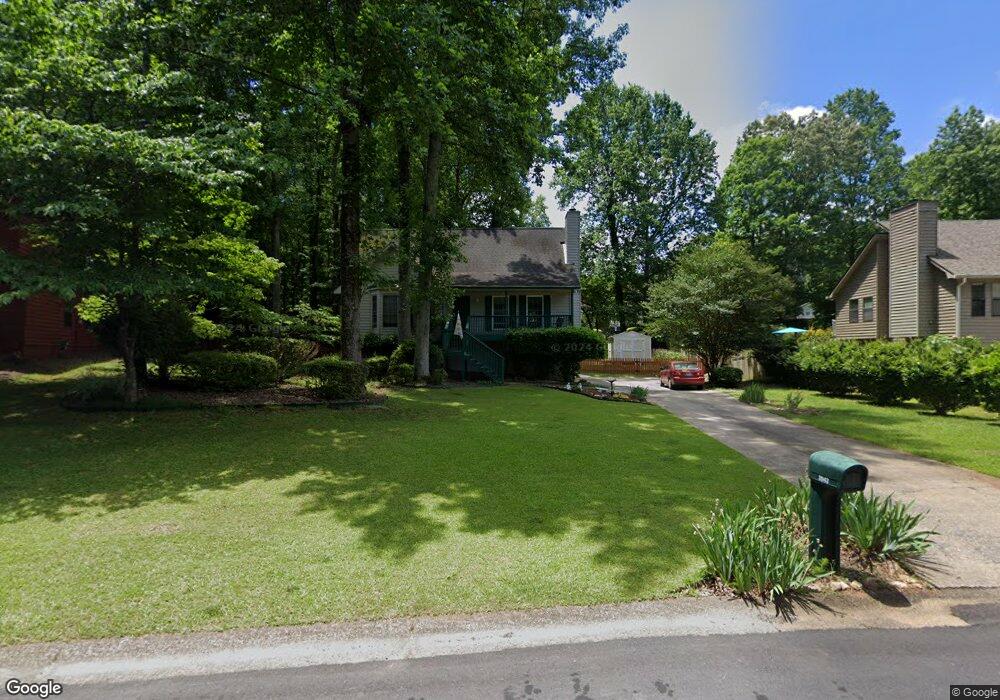
3942 N Indian Cir NW Kennesaw, GA 30144
Estimated Value: $345,000 - $433,000
3
Beds
2
Baths
2,112
Sq Ft
$181/Sq Ft
Est. Value
About This Home
This home is located at 3942 N Indian Cir NW, Kennesaw, GA 30144 and is currently estimated at $382,460, approximately $181 per square foot. 3942 N Indian Cir NW is a home located in Cobb County with nearby schools including Kennesaw Elementary School, Big Shanty Elementary School, and Awtrey Middle School.
Ownership History
Date
Name
Owned For
Owner Type
Purchase Details
Closed on
Sep 15, 2006
Sold by
Kohls Jesse
Bought by
Chimeno Michael and Chimeno Deborah
Current Estimated Value
Home Financials for this Owner
Home Financials are based on the most recent Mortgage that was taken out on this home.
Original Mortgage
$131,600
Outstanding Balance
$77,802
Interest Rate
6.48%
Mortgage Type
New Conventional
Estimated Equity
$304,658
Purchase Details
Closed on
Jul 18, 2003
Sold by
Caya John P and Caya Toni
Bought by
Kohls Jesse
Home Financials for this Owner
Home Financials are based on the most recent Mortgage that was taken out on this home.
Original Mortgage
$147,682
Interest Rate
5.16%
Mortgage Type
FHA
Purchase Details
Closed on
Apr 3, 1997
Sold by
Farley William T Anit
Bought by
Caya John P Toni
Create a Home Valuation Report for This Property
The Home Valuation Report is an in-depth analysis detailing your home's value as well as a comparison with similar homes in the area
Home Values in the Area
Average Home Value in this Area
Purchase History
| Date | Buyer | Sale Price | Title Company |
|---|---|---|---|
| Chimeno Michael | $164,500 | -- | |
| Kohls Jesse | $150,000 | -- | |
| Caya John P Toni | $109,000 | -- |
Source: Public Records
Mortgage History
| Date | Status | Borrower | Loan Amount |
|---|---|---|---|
| Open | Chimeno Michael | $131,600 | |
| Previous Owner | Kohls Jesse | $147,682 | |
| Closed | Caya John P Toni | $0 |
Source: Public Records
Tax History Compared to Growth
Tax History
| Year | Tax Paid | Tax Assessment Tax Assessment Total Assessment is a certain percentage of the fair market value that is determined by local assessors to be the total taxable value of land and additions on the property. | Land | Improvement |
|---|---|---|---|---|
| 2025 | $794 | $136,944 | $22,000 | $114,944 |
| 2024 | $796 | $136,944 | $22,000 | $114,944 |
| 2023 | $590 | $136,944 | $22,000 | $114,944 |
| 2022 | $736 | $116,580 | $22,000 | $94,580 |
| 2021 | $639 | $80,452 | $22,000 | $58,452 |
| 2020 | $639 | $80,452 | $22,000 | $58,452 |
| 2019 | $591 | $64,392 | $21,600 | $42,792 |
| 2018 | $591 | $64,392 | $21,600 | $42,792 |
| 2017 | $515 | $63,344 | $14,800 | $48,544 |
| 2016 | $493 | $56,764 | $14,800 | $41,964 |
| 2015 | $528 | $56,764 | $14,800 | $41,964 |
| 2014 | $341 | $38,308 | $0 | $0 |
Source: Public Records
Map
Nearby Homes
- 3856 Nowlin Rd NW
- 3182 Mckinley Ct
- 3902 Brave Trail NW
- 3104 Redwood Ln NW
- 3089 Kirkwood Dr NW
- 4146 McEver Park Dr
- 3789 Seattle Place NW
- 4026 Mcdowell Dr
- 4160 McEver Park Dr
- 4166 McEver Park Dr
- 3305 McEver Woods Cir NW
- 3516 Nowlin Rd NW
- 3833 Kirkwood Run NW
- 3906 Denbury Ct NW
- 4091 Fort Sumter Landing NW
- 3610 Darcy Ct NW
- 3910 Collier Trace NW
- 3944 N Indian Cir NW Unit 3
- 3940 N Indian Cir NW
- 3851 Nowlin Rd NW
- N N Indian Cir NW Unit 115
- N N Indian Cir NW
- 3853 Nowlin Rd NW
- 3946 N Indian Cir NW Unit 3
- 3938 N Indian Cir NW
- 3855 Nowlin Rd NW
- 3945 N Indian Cir NW
- 3943 N Indian Cir NW
- 3948 N Indian Cir NW Unit 115
- 3948 N Indian Cir NW
- 3857 Nowlin Rd NW
- 3947 N Indian Cir NW
- 3852 Nowlin Rd NW
- 3950 N Indian Cir NW
- 3701 Nowlin Ln NW
- 3848 Nowlin Rd NW
- 3854 Nowlin Rd NW