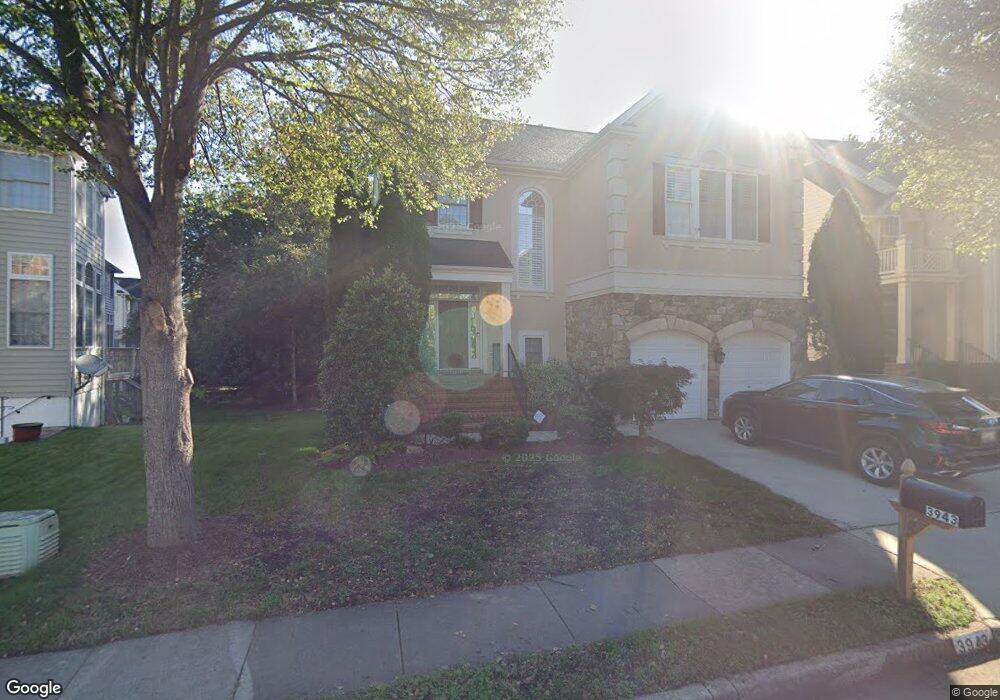
3943 Highland Oaks Dr Fairfax, VA 22033
Estimated Value: $1,172,000 - $1,260,000
5
Beds
5
Baths
4,483
Sq Ft
$273/Sq Ft
Est. Value
About This Home
This home is located at 3943 Highland Oaks Dr, Fairfax, VA 22033 and is currently estimated at $1,224,347, approximately $273 per square foot. 3943 Highland Oaks Dr is a home located in Fairfax County with nearby schools including Navy Elementary, Franklin Middle, and Chantilly High School.
Ownership History
Date
Name
Owned For
Owner Type
Purchase Details
Closed on
Nov 13, 2015
Sold by
So Pyong Ho
Bought by
Hong Justin
Current Estimated Value
Home Financials for this Owner
Home Financials are based on the most recent Mortgage that was taken out on this home.
Original Mortgage
$625,000
Outstanding Balance
$492,925
Interest Rate
3.87%
Mortgage Type
New Conventional
Estimated Equity
$731,422
Purchase Details
Closed on
Jun 16, 2004
Sold by
Murthy Mohini
Bought by
So Pyong H
Home Financials for this Owner
Home Financials are based on the most recent Mortgage that was taken out on this home.
Original Mortgage
$536,000
Interest Rate
6.12%
Mortgage Type
New Conventional
Purchase Details
Closed on
Feb 15, 2001
Sold by
U S Home Corporation
Bought by
Murthy Kanneganti
Home Financials for this Owner
Home Financials are based on the most recent Mortgage that was taken out on this home.
Original Mortgage
$275,000
Interest Rate
7.08%
Create a Home Valuation Report for This Property
The Home Valuation Report is an in-depth analysis detailing your home's value as well as a comparison with similar homes in the area
Home Values in the Area
Average Home Value in this Area
Purchase History
| Date | Buyer | Sale Price | Title Company |
|---|---|---|---|
| Hong Justin | $700,000 | Elim Title Llc | |
| So Pyong H | $670,000 | -- | |
| Murthy Kanneganti | $444,385 | -- |
Source: Public Records
Mortgage History
| Date | Status | Borrower | Loan Amount |
|---|---|---|---|
| Open | Hong Justin | $625,000 | |
| Previous Owner | So Pyong H | $536,000 | |
| Previous Owner | Murthy Kanneganti | $275,000 |
Source: Public Records
Tax History Compared to Growth
Tax History
| Year | Tax Paid | Tax Assessment Tax Assessment Total Assessment is a certain percentage of the fair market value that is determined by local assessors to be the total taxable value of land and additions on the property. | Land | Improvement |
|---|---|---|---|---|
| 2025 | $11,546 | $1,046,450 | $307,000 | $739,450 |
| 2024 | $11,546 | $996,640 | $280,000 | $716,640 |
| 2023 | $11,089 | $982,590 | $280,000 | $702,590 |
| 2022 | $9,929 | $868,340 | $262,000 | $606,340 |
| 2021 | $9,410 | $801,870 | $262,000 | $539,870 |
| 2020 | $8,866 | $749,130 | $248,000 | $501,130 |
| 2019 | $8,759 | $740,130 | $239,000 | $501,130 |
| 2018 | $8,490 | $738,290 | $238,000 | $500,290 |
| 2017 | $8,572 | $738,290 | $238,000 | $500,290 |
| 2016 | $8,553 | $738,290 | $238,000 | $500,290 |
| 2015 | $8,239 | $738,290 | $238,000 | $500,290 |
| 2014 | $7,745 | $695,560 | $228,000 | $467,560 |
Source: Public Records
Map
Nearby Homes
- 12975 Ridgemist Ln
- 3814 Highland Oaks Dr
- 3725 Freehill Ln
- 4001 Middle Ridge Dr
- 4107 Mount Echo Ln
- 4111 Mount Echo Ln
- 13102 Pennypacker Ln
- 4133 Point Hollow Ln
- 4200 Maylock Ln
- 4208 Mayport Ln
- 3878 Alder Woods Ct
- 3861 Alder Woods Ct
- 12820 Point Pleasant Dr
- 13201 Jasper Rd
- 13305 Hollinger Ave
- 12608 Victoria Station Ct
- 13320 Scibilia Ct
- 13204 Grand Junction Dr
- The Clifton Plan at Audubon Cove
- The Newport Plan at Audubon Cove
- 3945 Highland Oaks Dr
- 12831 Poplar Creek Dr
- 12829 Poplar Creek Dr
- 3947 Highland Oaks Dr
- 12827 Poplar Creek Dr
- 4038 Royal Lytham Dr
- 4041 Royal Lytham Dr
- 3949 Highland Oaks Dr
- 4036 Royal Lytham Dr
- 12825 Poplar Creek Dr
- 4039 Royal Lytham Dr
- 4034 Royal Lytham Dr
- 4037 Royal Lytham Dr
- 4032 Royal Lytham Dr
- 4035 Royal Lytham Dr
- 3951 Highland Oaks Dr
- 12823 Poplar Creek Dr
- 4033 Royal Lytham Dr
- 4030 Royal Lytham Dr
- 12901 Starters Ln