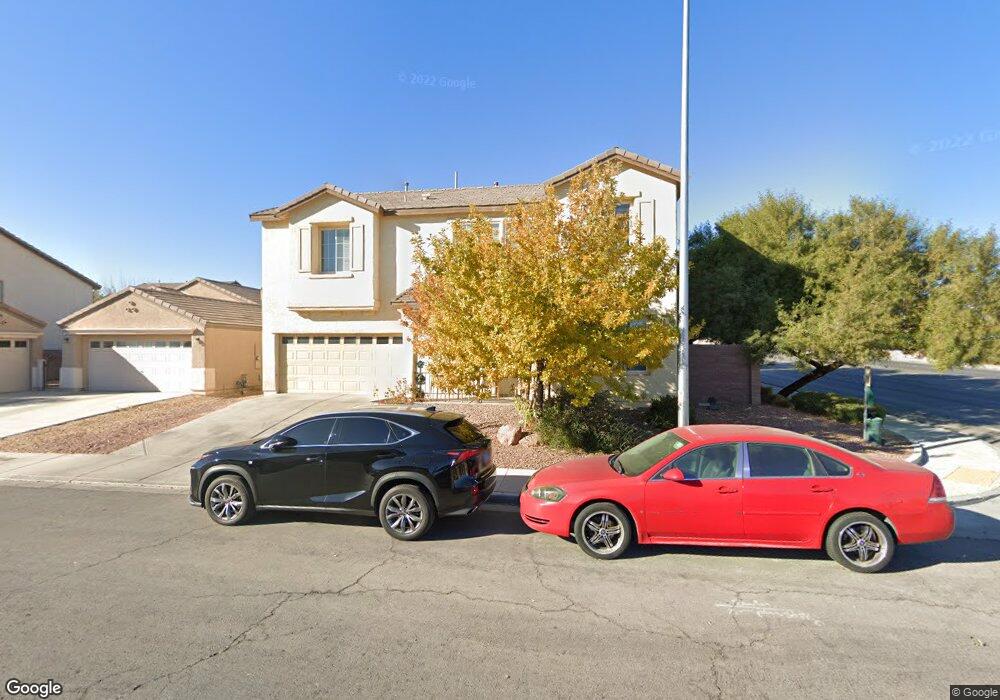
3943 Pansy Desert St North Las Vegas, NV 89032
Cheyenne NeighborhoodEstimated Value: $466,000 - $503,000
4
Beds
3
Baths
2,707
Sq Ft
$179/Sq Ft
Est. Value
About This Home
This home is located at 3943 Pansy Desert St, North Las Vegas, NV 89032 and is currently estimated at $485,497, approximately $179 per square foot. 3943 Pansy Desert St is a home located in Clark County with nearby schools including Elizabeth Wilhelm Elementary School, Dr. Claude G Perkins Elementary School, and Marvin M Sedway Middle School.
Ownership History
Date
Name
Owned For
Owner Type
Purchase Details
Closed on
Jun 19, 2007
Sold by
Us Home Corp
Bought by
Gonzalez Beatriz
Current Estimated Value
Home Financials for this Owner
Home Financials are based on the most recent Mortgage that was taken out on this home.
Original Mortgage
$239,992
Outstanding Balance
$148,276
Interest Rate
6.37%
Mortgage Type
New Conventional
Estimated Equity
$337,221
Purchase Details
Closed on
Oct 7, 2006
Sold by
Celebrate Holdings Llc
Bought by
Us Home Corp
Create a Home Valuation Report for This Property
The Home Valuation Report is an in-depth analysis detailing your home's value as well as a comparison with similar homes in the area
Home Values in the Area
Average Home Value in this Area
Purchase History
| Date | Buyer | Sale Price | Title Company |
|---|---|---|---|
| Gonzalez Beatriz | $299,990 | North American Title Co | |
| Us Home Corp | $4,209,192 | North American Title Co |
Source: Public Records
Mortgage History
| Date | Status | Borrower | Loan Amount |
|---|---|---|---|
| Open | Gonzalez Beatriz | $239,992 |
Source: Public Records
Tax History Compared to Growth
Tax History
| Year | Tax Paid | Tax Assessment Tax Assessment Total Assessment is a certain percentage of the fair market value that is determined by local assessors to be the total taxable value of land and additions on the property. | Land | Improvement |
|---|---|---|---|---|
| 2025 | $2,503 | $142,953 | $31,850 | $111,103 |
| 2024 | $2,318 | $142,953 | $31,850 | $111,103 |
| 2023 | $1,543 | $141,420 | $33,600 | $107,820 |
| 2022 | $2,147 | $125,563 | $27,300 | $98,263 |
| 2021 | $1,988 | $104,279 | $25,200 | $79,079 |
| 2020 | $1,843 | $102,453 | $25,200 | $77,253 |
| 2019 | $1,727 | $96,440 | $19,600 | $76,840 |
| 2018 | $1,648 | $82,240 | $17,500 | $64,740 |
| 2017 | $2,621 | $78,132 | $16,100 | $62,032 |
| 2016 | $1,543 | $60,857 | $11,550 | $49,307 |
| 2015 | $1,540 | $44,441 | $7,000 | $37,441 |
| 2014 | $1,491 | $45,644 | $7,000 | $38,644 |
Source: Public Records
Map
Nearby Homes
- 3941 Copper Stone Ct
- 324 Moonlight Glow Ave
- 312 Purple Passion Ave
- 3928 Ropers Ranch St
- 4013 Kindhearted Ct
- 4130 Neighborly Ct
- 31 Winley Chase Ave
- 33 Newburg Ave
- 320 Gray Robin Ave
- 3837 White Quail Ct Unit 3
- 314 Hopedale Ave
- 124 Zenith Point Ave
- 4350 Westbury Square St Unit 2
- 3827 Blue Gull St
- 3740 Shadow Tree St
- 3736 Shadow Tree St
- 390 Clarence House Ave Unit 1
- 532 Shallow Mist Ct
- 470 Dorchester Bend Ave Unit 3
- 455 Westminster Hall Ave Unit 101
- 3939 Pansy Desert St Unit 3
- 3935 Pansy Desert St
- 3942 Royal Stone Ct
- 3938 Royal Stone Ct
- 3944 Pansy Desert St Unit 3
- 3934 Royal Stone Ct
- 3931 Pansy Desert St
- 3940 Pansy Desert St
- 3930 Royal Stone Ct
- 112 Granite Stone Ave
- 269 Honey Burst Ave
- 3922 Royal Stone Ct
- 265 Honey Burst Ave
- 3929 Royal Stone Ct
- 3921 Woodland Hills Ct
- 108 Granite Stone Ave
- 3917 Woodland Hills Ct
- 3925 Royal Stone Ct
- 3918 Royal Stone Ct
- 3920 Woodland Hills Ct