Estimated Value: $340,000 - $381,000
3
Beds
1
Bath
720
Sq Ft
$510/Sq Ft
Est. Value
About This Home
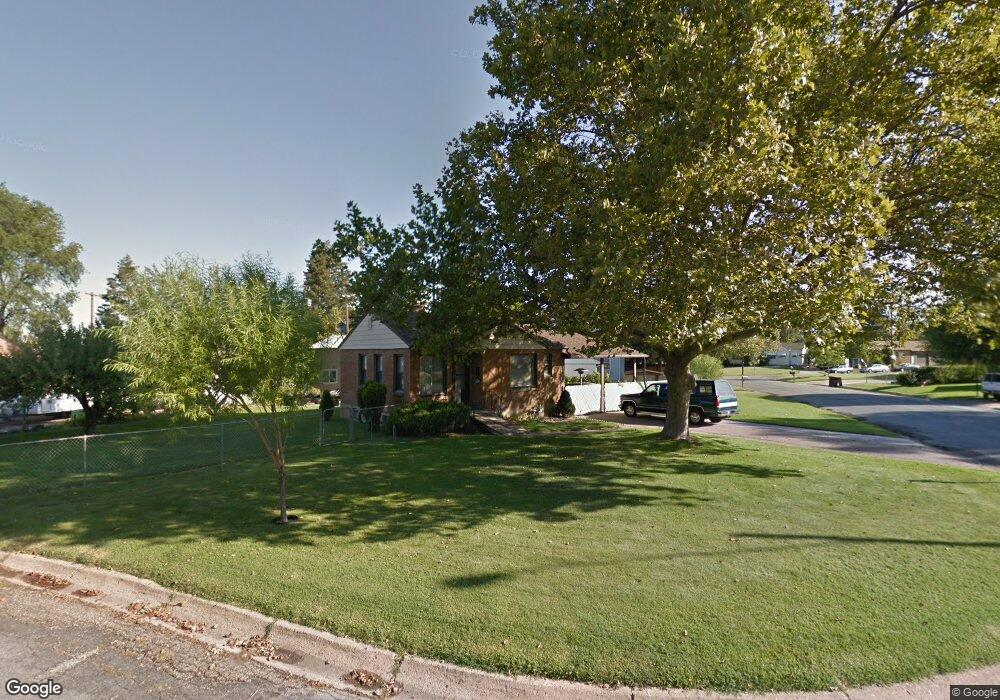
This home is located at 3943 S 2075 W, Roy, UT 84067 and is currently estimated at $367,507, approximately $510 per square foot. 3943 S 2075 W is a home located in Weber County with nearby schools including North Park School, Sand Ridge Junior High School, and Roy High School.
Ownership History
Date
Name
Owned For
Owner Type
Purchase Details
Closed on
May 24, 2022
Sold by
Johnson Trust
Bought by
Johnson David Eugene
Current Estimated Value
Home Financials for this Owner
Home Financials are based on the most recent Mortgage that was taken out on this home.
Original Mortgage
$256,512
Outstanding Balance
$241,662
Interest Rate
5%
Mortgage Type
Balloon
Estimated Equity
$125,845
Purchase Details
Closed on
May 24, 2021
Sold by
Eugene Johnson David
Bought by
Johnson Trust
Purchase Details
Closed on
Jul 1, 2020
Sold by
Johnson David Eugene
Bought by
Johnson David Eugene and Johnson Trust
Home Financials for this Owner
Home Financials are based on the most recent Mortgage that was taken out on this home.
Original Mortgage
$221,350
Interest Rate
3.2%
Mortgage Type
New Conventional
Purchase Details
Closed on
May 4, 2000
Sold by
Kennedy Shirley John and Kennedy Beverly R
Bought by
Kennedy Shirley J and Kennedy Beverly R
Create a Home Valuation Report for This Property
The Home Valuation Report is an in-depth analysis detailing your home's value as well as a comparison with similar homes in the area
Home Values in the Area
Average Home Value in this Area
Purchase History
| Date | Buyer | Sale Price | Title Company |
|---|---|---|---|
| Johnson David Eugene | -- | Stewart Title | |
| Johnson Trust | -- | Stewart Title | |
| Johnson David Eugene | -- | Mountain View Title Ogden | |
| Johnson David Eugene | -- | Mountain View Title | |
| Kennedy Shirley J | -- | -- |
Source: Public Records
Mortgage History
| Date | Status | Borrower | Loan Amount |
|---|---|---|---|
| Open | Johnson David Eugene | $256,512 | |
| Previous Owner | Johnson David Eugene | $221,350 |
Source: Public Records
Tax History
| Year | Tax Paid | Tax Assessment Tax Assessment Total Assessment is a certain percentage of the fair market value that is determined by local assessors to be the total taxable value of land and additions on the property. | Land | Improvement |
|---|---|---|---|---|
| 2025 | $2,159 | $332,983 | $124,277 | $208,706 |
| 2024 | $2,111 | $180,398 | $68,410 | $111,988 |
| 2023 | $2,038 | $174,350 | $62,563 | $111,787 |
| 2022 | $2,205 | $196,350 | $54,326 | $142,024 |
| 2021 | $1,799 | $262,000 | $68,514 | $193,486 |
| 2020 | $1,623 | $216,000 | $68,514 | $147,486 |
| 2019 | $1,615 | $203,000 | $42,847 | $160,153 |
| 2018 | $1,467 | $172,000 | $37,726 | $134,274 |
| 2017 | $1,309 | $142,000 | $35,709 | $106,291 |
| 2016 | $1,183 | $68,153 | $14,123 | $54,030 |
| 2015 | $1,045 | $60,675 | $17,457 | $43,218 |
| 2014 | $1,016 | $58,045 | $17,457 | $40,588 |
Source: Public Records
Map
Nearby Homes
- 3923 S 1975 W Unit 15
- 1959 3985 St S Unit 2
- 1940 W 3920 S
- 2240 W 3875 S
- 1910 W 3920 S
- 4047 S 2175 W
- 4061 S 2175 W
- 3705 S 2025 W
- 4220 S 2075 W
- 3800 S 1900 W Unit 196
- 3800 S 1900 W Unit 257
- 3800 S 1900 W Unit 248
- 3800 S 1900 W Unit 111
- 3800 S 1900 W Unit 144
- 3800 S 1900 W Unit 28
- 3800 S 1900 W Unit 66
- 3800 S 1900 W Unit 163
- 3800 S 1900 W Unit 295
- 3800 S 1900 W Unit 241
- 3800 S 1900 W Unit 133
Your Personal Tour Guide
Ask me questions while you tour the home.